Vue中使用Highstock实现蜡烛图和MACD、Boll指标 --知识铺
关键词
Highstock candlestick macd Boll Tooltip
Github
展示
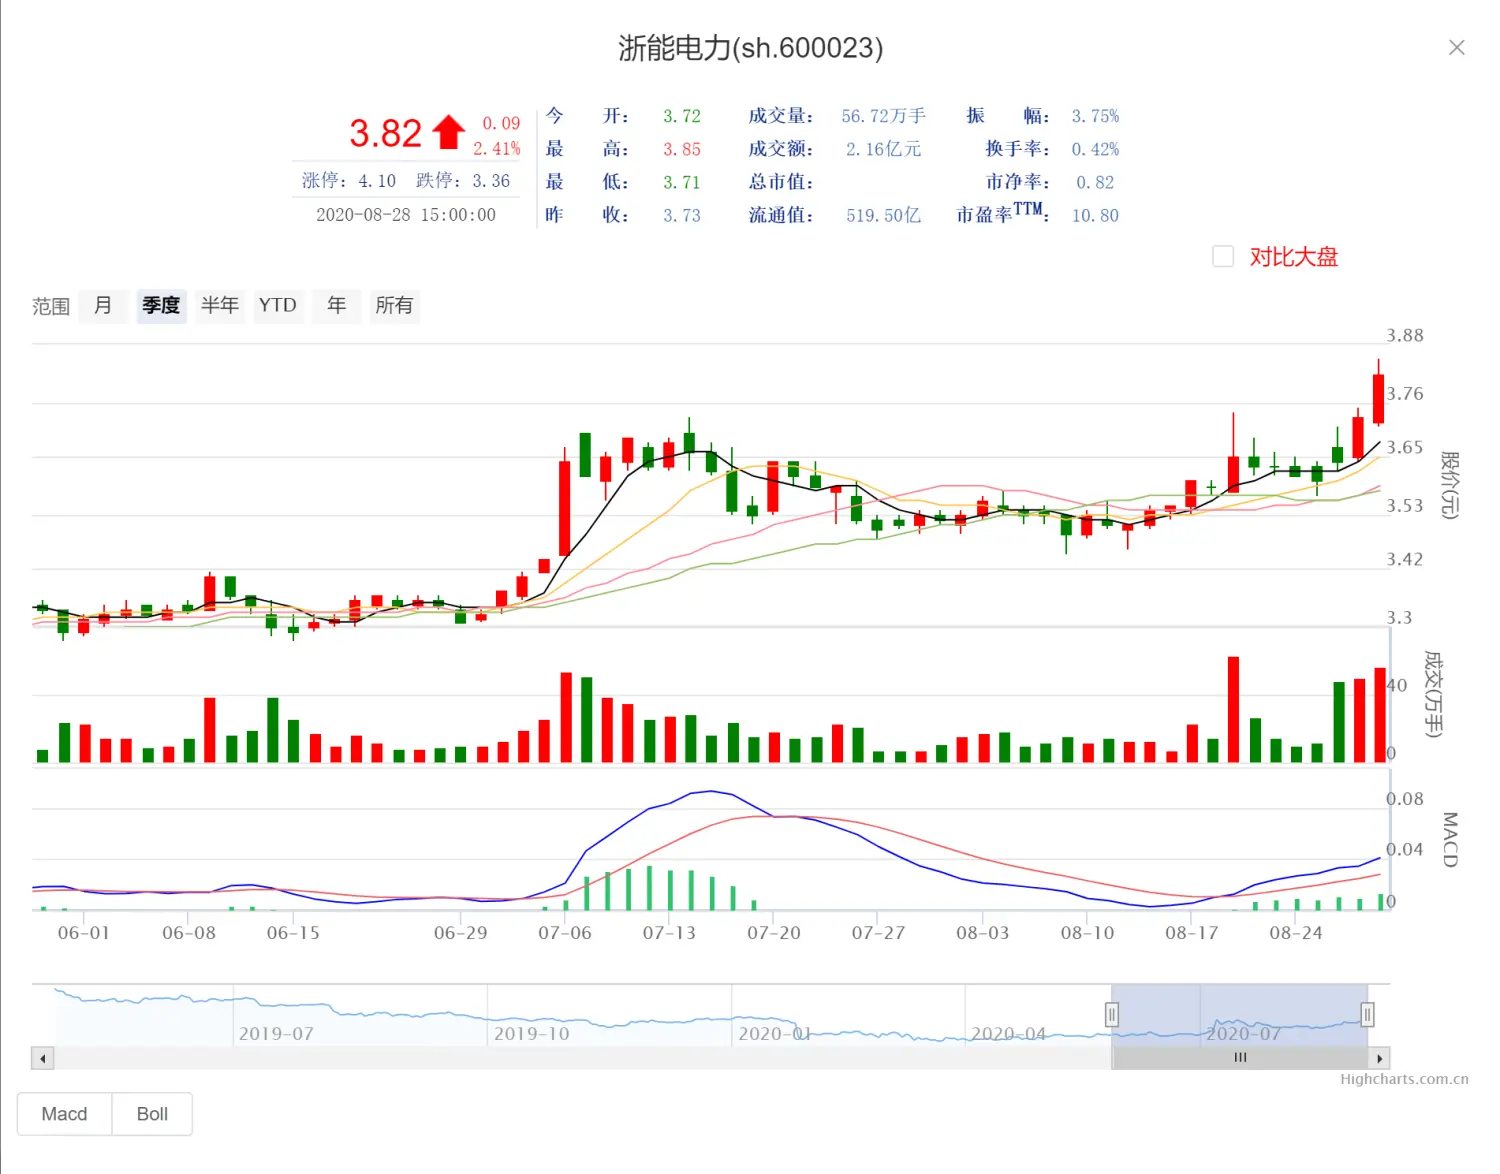
添加了MACD和BOLL指标
实现了MACD和BOLL指标的切换
修改了Tooltip展示方式
MACD和Boll指标
在第九篇 使用CDN加速Vue的加载过程中我们介绍了怎么引入Highstock的技术指标,这里我们用了MACD和Boll。
{
  yAxis: "macd",
  type: "macd",     //macd 指标
  linkedTo: "maindayk",    //使用计算macd的数据
  color: "#f05f5f",            //MACD线颜色
  params: {
    shortPeriod: 12,           //macd计算使用的参数
    longPeriod: 26,
    signalPeriod: 9,
    period: 26
  },
  zones: [
    {
      value: 0,                 //大于0的在这个区
      color: "#f05f5f"       //红柱
    },
    {
      color: "#31c26d"     //绿柱
    }
  ],
  macdLine: {
    styles: {
      lineColor: "blue",    //信号线颜色
      lineWidth: 1
    }
  },
  maxPointWidth: 2,
  visible: true,
  id : "macdseries"
}
{
  type: 'bb',     //bollinger 指标
  topLine: {
    styles: {
      lineColor: "#ffc349"    //上轨线颜色
    }
  },
  bottomLine: {
    styles: {
      lineColor: 'purple'     //下轨线颜色
    }
  },
  color: '#006cee',        //中轨颜色
  yAxis: "boll",            //对应坐标轴
  name: '布林(20,2)',
  linkedTo: 'bollingdayk',         //计算boll的数据
  id : "bollingseries"
}
指标切换
这里添加了两个按键用于切换macd和boll,·刚开始的时候想用之前对比大盘的方式,先把macd和boll都放进series,然后用 chart.series[x].show()和chart.series[x].hide()来实现切换,但是最后发现不行,其他的数据都消失了,怀疑是在hide的时候把series index变了。
在highchart的中文论坛没找到解决方案,最后去英文论坛找到了可能的解决方案
Multi series with different yAxis
可以使用series.add()和series.remove()方法来动态加载macd和boll
setToMacd() {
  chart.addSeries({
  //macd series
  })
  chart.get("bollingdayk").remove()
  chart.get("bollingseries").remove()
}
setToBoll() {
  chart.addSeries({
  //boll series
  })
  chart.get("macdseries").remove()
}
自定义Tooltip
因为默认的话会出现MACD或Boll的信息,而且没有涨跌幅的信息,所以需要自定义tooltip。
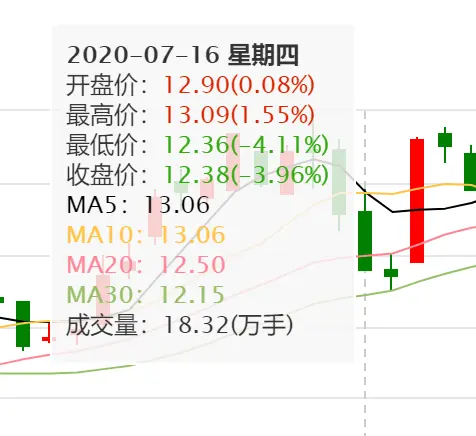
注意这里要用 shared: true, 这样可以使用this.points[x]来拿到第几个series的数据。具体可以用console.log(this)来查看到底有什么内容。
this.stockOptions.tooltip = {
          formatter: function() {
               if(this.y == undefined){
                   return;
               }
               for(var i =0;i<tipd.length;i++){
                   if(this.x == tipd[i][0]){
                       openper = tipd[i][1].toFixed(2);
                       highper = tipd[i][2].toFixed(2);
                       lowper = tipd[i][3].toFixed(2);
                       closeper = tipd[i][4].toFixed(2);
                       preclose = tipd[i][5].toFixed(2);
                   }
               }
               let length = this.points.length
               open = this.points[0].point.open.toFixed(2);
               high = this.points[0].point.high.toFixed(2);
               low = this.points[0].point.low.toFixed(2);
               close = this.points[0].point.close.toFixed(2);
               let vol = this.points[1].point.y.toFixed(2);
               relativeWidth = this.points[0].point.shapeArgs.x;
              var tip= '<b>'+ Highcharts.dateFormat('%Y-%m-%d  %A', this.x) +'</b><br/>';
              if(open>preclose){
                  tip += '开盘价:<span style="color: #DD2200;">'+open+ '(' + openper + '%) </span><br/>';
              }else{
                  tip += '开盘价:<span style="color: #33AA11;">'+open+ '(' + openper + '%) </span><br/>';
              }
              if(high>preclose){
                  tip += '最高价:<span style="color: #DD2200;">'+high+ '(' + highper + '%) </span><br/>';
              }else{
                  tip += '最高价:<span style="color: #33AA11;">'+high+ '(' + highper + '%) </span><br/>';
              }
              if(low>preclose){
                  tip += '最低价:<span style="color: #DD2200;">'+low+ '(' + lowper + '%) </span><br/>';
              }else{
                  tip += '最低价:<span style="color: #33AA11;">'+low+ '(' + lowper + '%) </span><br/>';
              }
              if(close>preclose){
                  tip += '收盘价:<span style="color: #DD2200;">'+close+ '(' + closeper + '%) </span><br/>';
              }else{
                  tip += '收盘价:<span style="color: #33AA11;">'+close+ '(' + closeper + '%) </span><br/>';
              }
              if(length > 2) {
                let MA5 = this.points[2].y.toFixed(2);
                tip += '<span style="color: #000000;">MA5:'+ MA5 + '</span><br/>';
              }
              if(length > 3) {
                let MA10 = this.points[3].y.toFixed(2);
                tip += '<span style="color: #ffc349;">MA10:'+ MA10 + '</span><br/>';
              }
              if(length > 4) {
                let MA20 = this.points[4].y.toFixed(2);
                tip += '<span style="color: #ff8796;">MA20:'+ MA20 + '</span><br/>';
              }
              if(length > 5) {
                let MA30 = this.points[5].y.toFixed(2);
                tip += '<span style="color: #97c068;">MA30:'+ MA30 + '</span><br/>';
              }
              tip += "成交量:"+vol+"(万手)<br/>";
              return tip;
          },
          crosshairs: {
                   dashStyle: 'dash'
           },
               borderColor:    'white',
            shadow: false,
            shared: true
        }
免责声明:以上用于市场研究、讨论和交流之目的
- 原文作者:知识铺
- 原文链接:https://index.zshipu.com/stocktactics/post/20240413/Vue%E4%B8%AD%E4%BD%BF%E7%94%A8Highstock%E5%AE%9E%E7%8E%B0%E8%9C%A1%E7%83%9B%E5%9B%BE%E5%92%8CMACDBoll%E6%8C%87%E6%A0%87--%E7%9F%A5%E8%AF%86%E9%93%BA/
- 版权声明:本作品采用知识共享署名-非商业性使用-禁止演绎 4.0 国际许可协议进行许可,非商业转载请注明出处(作者,原文链接),商业转载请联系作者获得授权。
- 免责声明:本页面内容均来源于站内编辑发布,部分信息来源互联网,并不意味着本站赞同其观点或者证实其内容的真实性,如涉及版权等问题,请立即联系客服进行更改或删除,保证您的合法权益。转载请注明来源,欢迎对文章中的引用来源进行考证,欢迎指出任何有错误或不够清晰的表达。也可以邮件至 sblig@126.com