Strategy Link: http://tos.mx/P3mxTl4 (Click Setup, Open Shared Item, Paste the Link)
Alternatively, to use the strategy code below (not the link above) click on the charts tab, studies button, edit studies, strategies tab, create, copy and paste the first code in and change the name at the top to your liking, click ok. Make sure to follow the rules on the first post regarding time frame, extended hours etc.
Watchlist Indicator: http://tos.mx/KDtke7m (Click Setup, Open Shared Item, Paste the Link)
For the watchlist custom indicator (again, the code is below not the link above) click the gear icon on your watchlist, customize, type in “custom”, click the small scroll looking icon to the left of an unused custom study, paste the second code in and change the name to your liking (something short), change the “D” to “5m” and check extended hours, click ok.
This is just the preview. More detailed instructions below.
I WILL ADD ALL UPDATES HERE! This strategy is changing and I don’t want to confuse anyone with comments from previous versions in the post below!!!
This is months of trial and error with different strategies and indicators. This is what I have found that works best as of today. I am continually updating this strategy to refine it and/or find better entries and exits. All updates will be posted here on Post #1.
This strategy USES two EMAs (5EMA, 12EMA), MACD, TSI, and Pre-Market High/Low. The EMAs are arranged in a cloud (5EMA / 12EMA). This strategy also INCLUDES but does not USE the 34EMA, 50EMA, and Yesterdays High/Low. These can be turned on and off to your liking.
TSI >10 and trending up or TSI <-10 and trending down
Low > the Pre-Market High or High < the Pre-Market Low
Again, subject to change.
Of note, I use this for options so the wording I use in the strategy is geared towards that.
Gray Candles - Criteria Not Met
Red Candle - Put Buy or Sell to Open (Short) (Entry is on the 5EMA or When you get the Buy Bubble)
Light Red Candle - Put Hold or Short Hold
Green Candle - Call Buy or Buy to Open (Long) (Entry is on 5EMA or when you get the Buy Bubble)
Light Green Candle - Call Hold or Long Hold
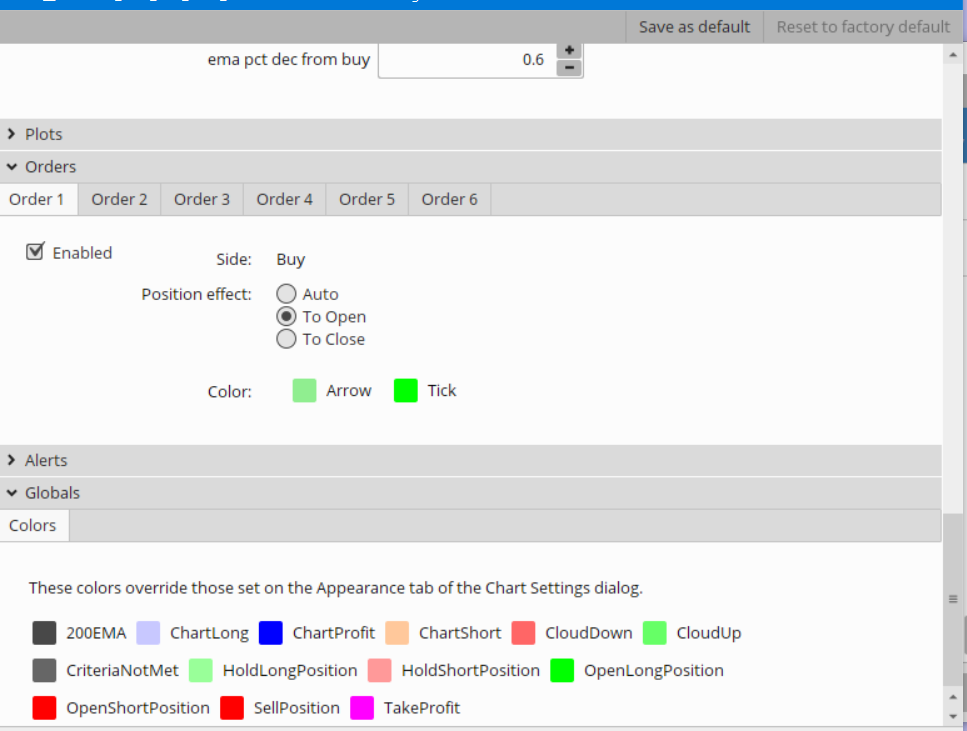
Candle colors can be changed using the gear icon, scrolling to the very bottom and changing the “globals” settings.
Very basic instructions…
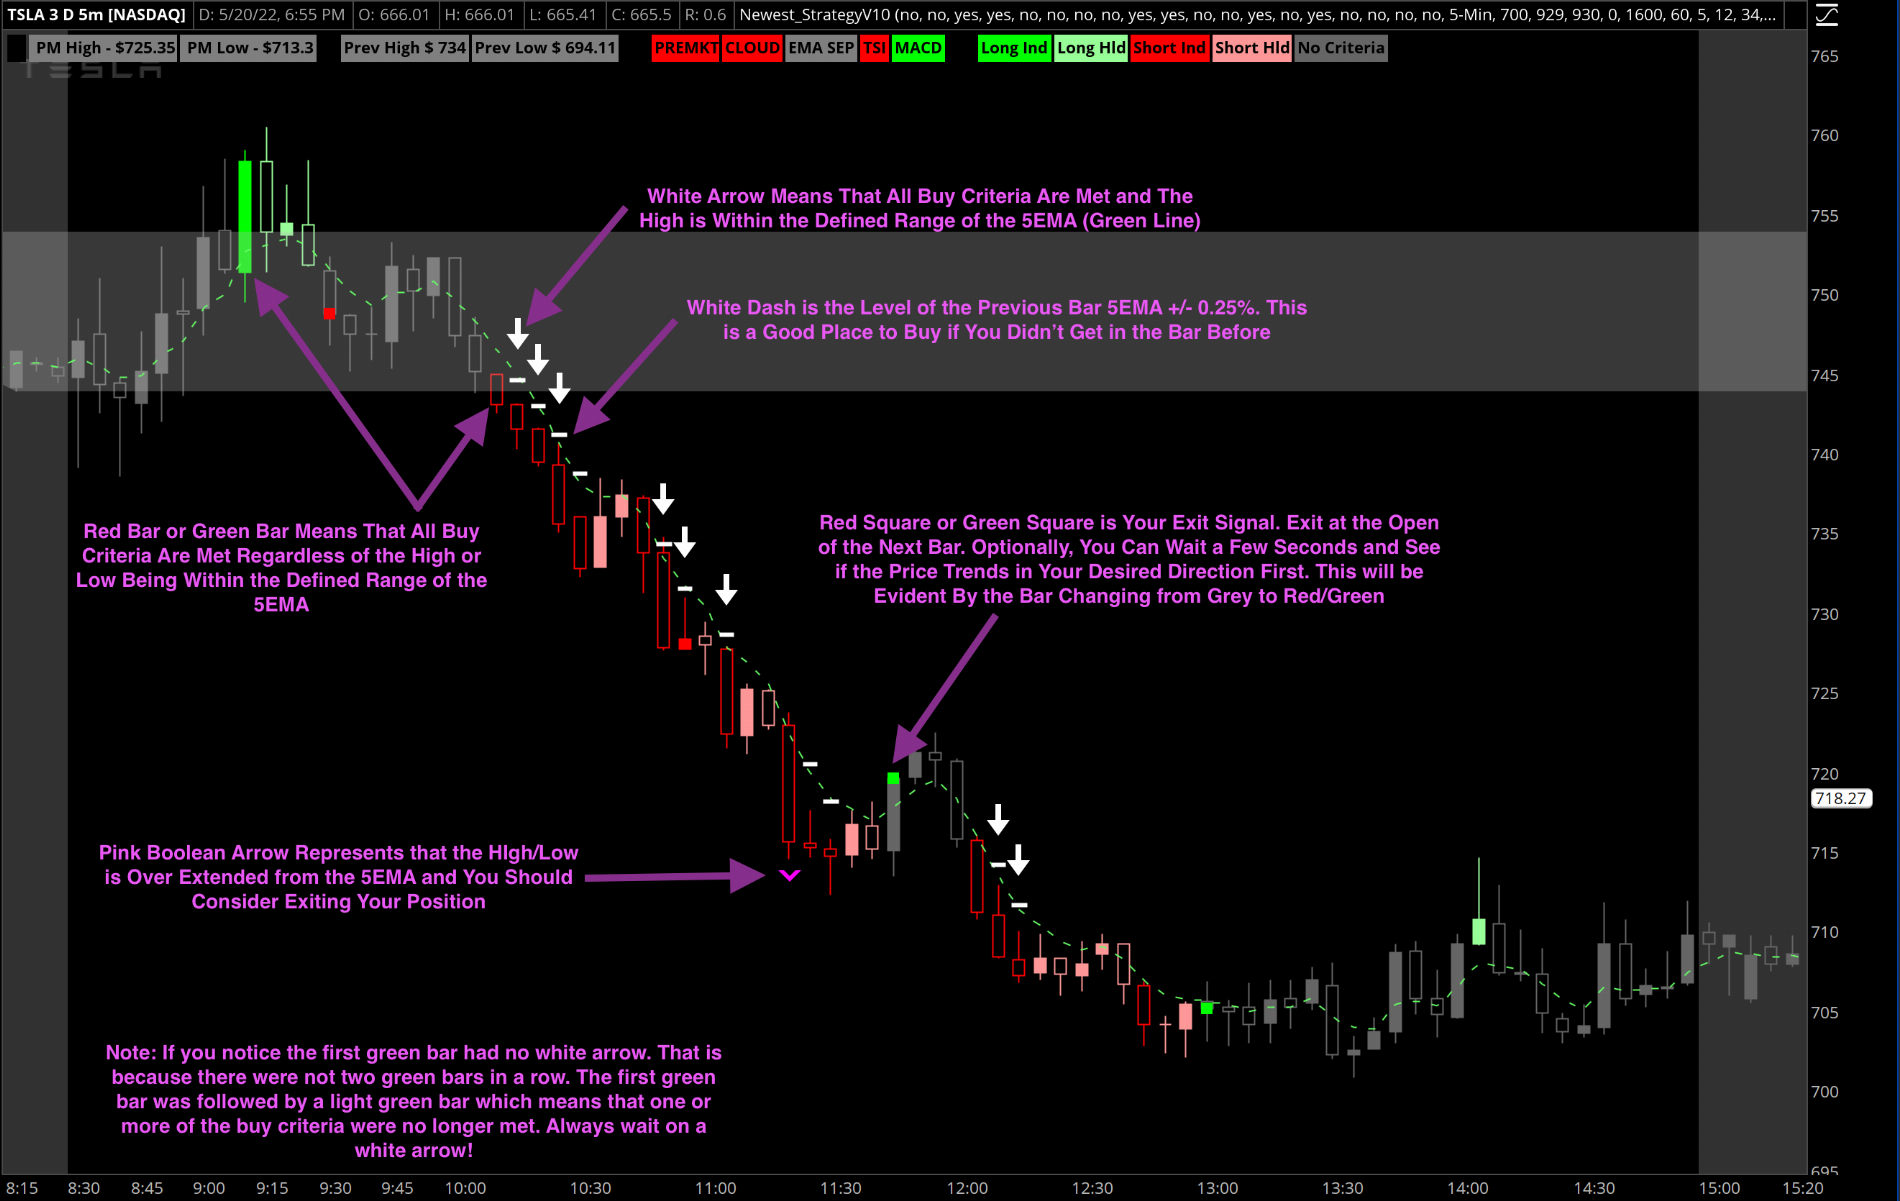
If you FOMO in at the beginning of the day without a buy signal, which you shouldn’t, and you get a Pink Boolean Arrow than GET OUT! The price is too extended from the EMA and you are just asked for a knife candle to kill your profits.
If you were patient and waited on the Buy Signal (white arrow) then get in on that 5EMA (green dashed line) or better. Alternatively, if you missed your entry, then try to get in at least on the white dash or better. This was the entry point from the previous candle.
You should not get a Buy Signal unless the price is already within the defined range of the 5EMA.
If you are confident in your order placing abilities and the spread isn’t too wide you can even set a trailing stop buy order to try to get the best price.
If you get a Pink Boolean Arrow then again, really think about taking profits.
This is a great spot for a trailing stop depending on the spread!
If you get a Grey Candle than get ready to close your trade at the open of the next bar. Don’t get in a hurry though because sometimes the candle will repaint and continue with your trend.
Rinse and Repeat. Don’t Get Fancy! Let It work or move on to a stock that is working!
The difference in my trading waiting on that 5EMA entry was a game changer. In options, if I rushed into a trade that gave me a buy signal before it came back to the 5EMA I might be down 50% within seconds before maybe recovering. However, if I wait on that 5 EMA entry I may never be down or at worst 15%-20% before becoming profitable.
I added labels to the top of the chart for each criteria this strategy is looking for. This will help you “get ready” to buy. If they are all red then get ready to go short or buy puts on that 5EMA. If they are all green than again, get ready to go long or buy calls on that 5EMA.
I THINK the labels should go green/blue from left to right if the stock cooperates. I have noticed that the biggest thing holding up the entry is MACD direction and price at the 5EMA at the same time but then again, that is what makes it mostly* dependable.
Once you are in the trade you can stop looking at the labels. At that point you are just waiting for the grey candle or pink boolean arrow for your exit.
WIth that being said, be careful with options and this study! I chose my stocks based on my 2+ years of trading experience and look at support/resistance to chose the right strike. I am excited about this strategy because every single backtest I ran on every ticker on my watchlist was profitable over the past 10 days when trading 100 shares at a time.
Few Rules:
To be used on 5 minute charts. That is all I have tested it on.
Must have Extended Hours on and I prefer 3 Day / 5 Min zoomed in.
Copy the code and paste it as a STRATEGY not study.
If you so choose, turn on the “Over Ext Clouds”. That is a take profit spot where you would get the pink boolean arrow.
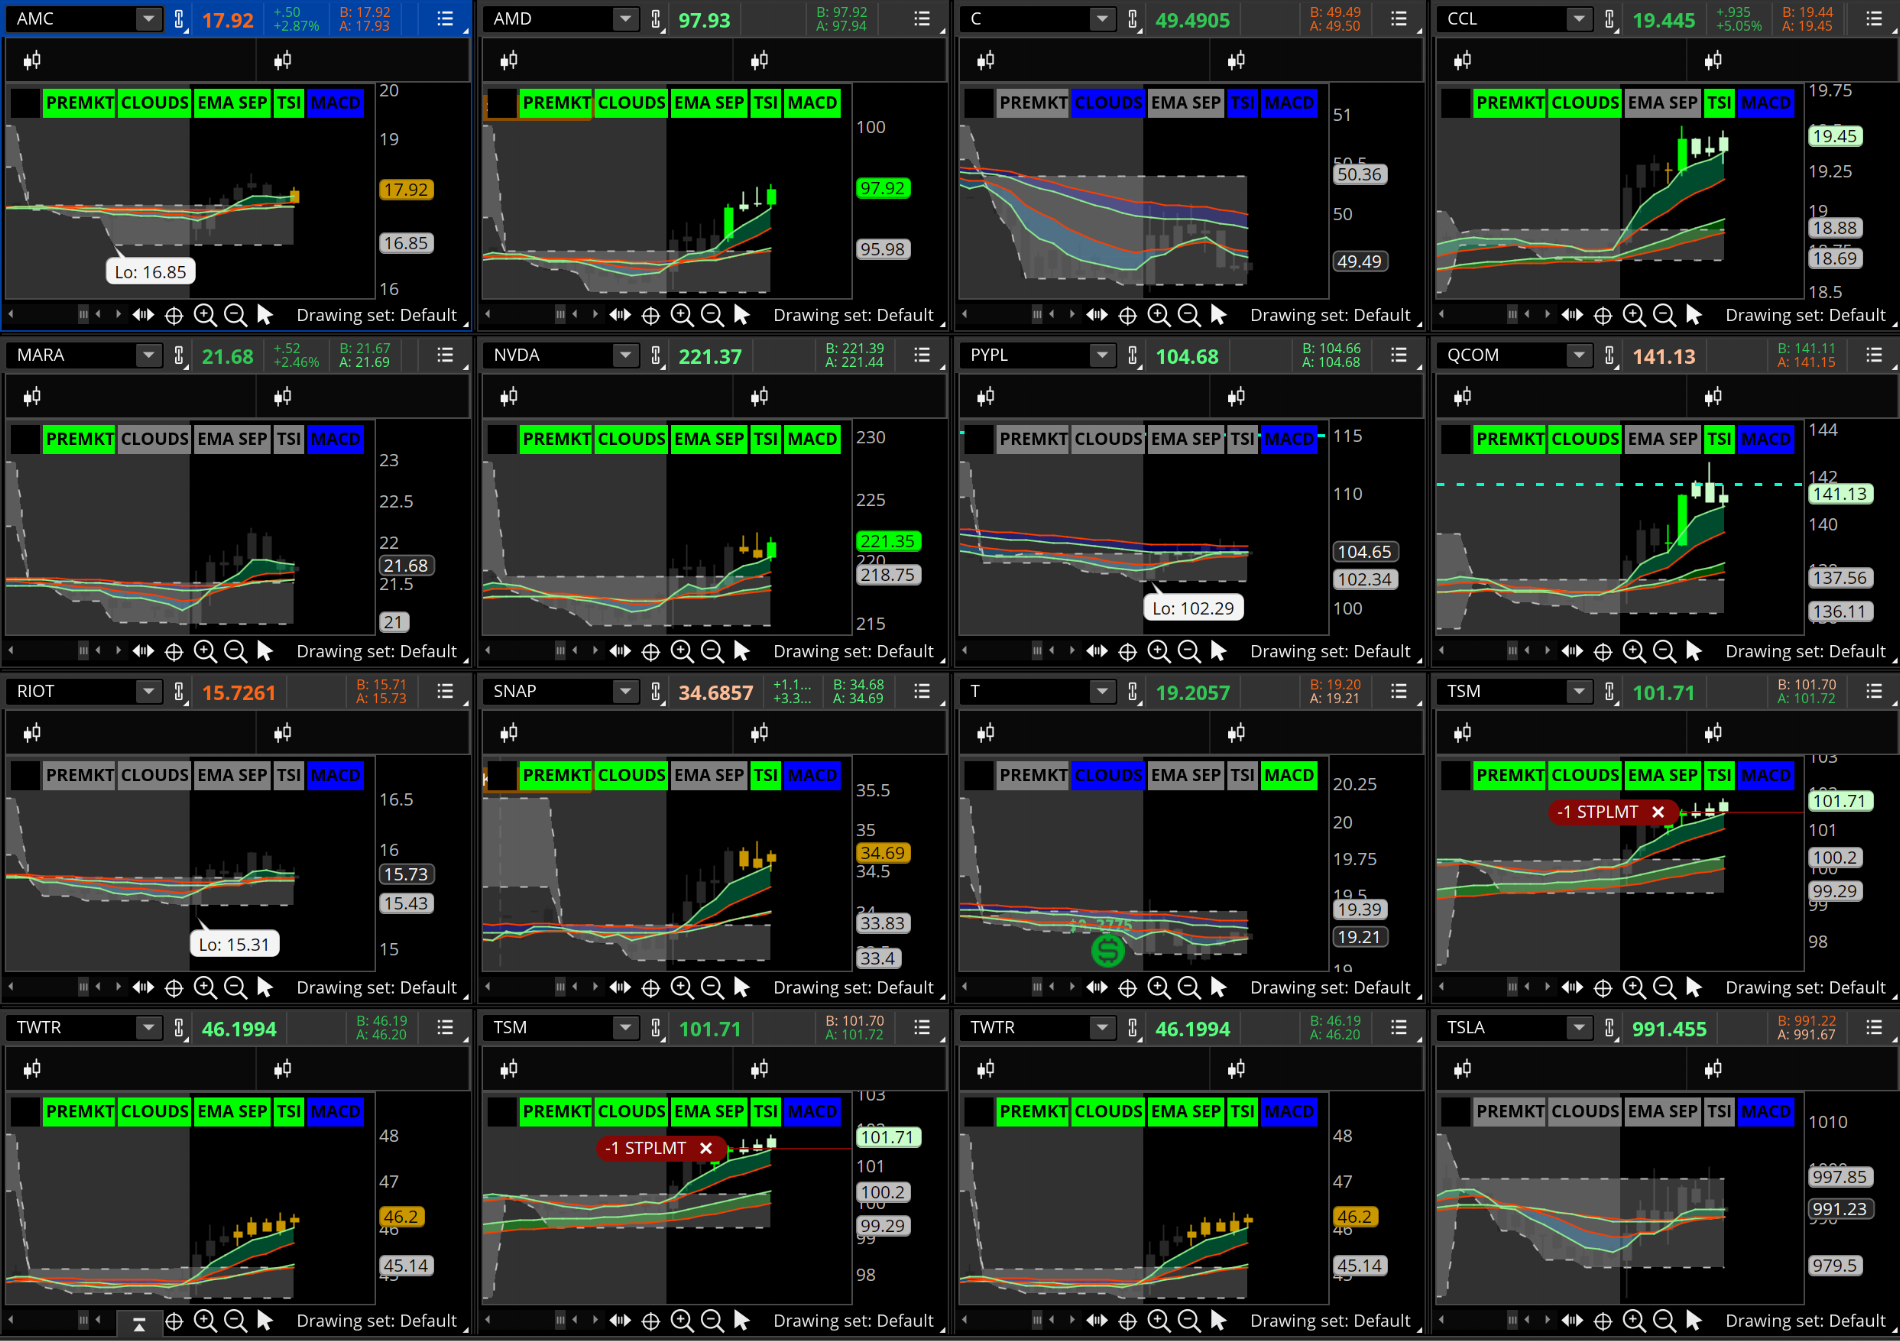
There is no scanner yet but some users are trying to create one that works (one or two are floating around the comments now). I use a flexible grid with 16 charts and load the tickers that I am looking at that particular day. This allows for the fastest response for me personally. Link at the top.
Code:
#JT Newest Strategy Based on EMAs, TSI, Premarket Highs/Lows, and MACD
#VERSION 10.4 - 05/31/2022
#Notes
Declare Upper;
##################################################################
# OPTIONS #
##################################################################
input ShowTestBubbles = no;
input ShowFlexGridBackgroundColor = no;
input ShowColorDefLabels = yes;
input AlertOn = yes;
input Show200EMA = no;
input ShowFastEMALines = no;
input ShowFastEMACloud = no;
input ShowSlowEMALines = no;
input ShowSlowEMACloud = no;
input ShowPreMarketLines = no;
input ShowPreMarketCloud = no;
input ShowPreMarketLabel = yes;
input ShowPrevDayLines = no;
input ShowPrevDayCloud = no;
input ShowPrevHighLowLabel = no;
input ShowBuySellBubbles = no;
input ShowArrows = yes;
input ShowSquares = yes;
input ShowDashes = yes;
input ShowBooleanArrows = yes;
input ShowOverExtCloud = no;
input ShowTkPftBubble = no;
input ShowOrders = no;
input ShowTkPftOrders = no;
##################################################################
# COLORS #
##################################################################
DefineGlobalColor("200EMA", createcolor (255, 255, 255));
DefineGlobalColor("CloudUp", createcolor (102, 255, 102));
DefineGlobalColor("CloudDown", createcolor (255, 102, 102));
DefineGlobalColor("OpenLongPosition", createcolor (0, 255, 0));
DefineGlobalColor("OpenShortPosition", createcolor (255, 0, 0));
DefineGlobalColor("HoldLongPosition", createcolor (153, 255, 153));
DefineGlobalColor("HoldShortPosition", createcolor (255, 153, 153));
DefineGlobalColor("SellPosition", createcolor (255, 0, 0));
DefineGlobalColor("TakeProfit", createcolor (255, 0, 255));
DefineGlobalColor("CriteriaNotMet", createcolor (102, 102, 102)); #(255, 255, 0)
##################################################################
# TIMES #
##################################################################
#START AND END TIMES
input TimeFrame = {default "5-Min", "1-Min", "10-Min", "15-Min", "30-Min", "1-Hour"};
input PreMarketStart = 0700; #EST
input PreMarketEnd = 0929; #EST
input StartTime = 0930; #EST
input BuySignalDelay = 0;
input EndTime = 1600; #EST
input BuySignalStop = 60; #Minutes Before End of Day
def LastCandleStop; #Last Candle is Sell Candle
switch (TimeFrame) {
case "1-min": LastCandleStop = 1;
case "10-Min": LastCandleStop = 10;
case "15-Min": LastCandleStop = 15;
case "30-Min": LastCandleStop = 30;
case "1-Hour": LastCandleStop = 60;
default: LastCandleStop = 5;
}
def TradingDayStart= SecondsFromTime(StartTime);
def BuySignalDelaySeconds = BuySignalDelay * 60;
def SignalStart = TradingDayStart > BuySignalDelaySeconds;
def TradingDayEnd = SecondsTillTime(EndTime);
def EndSignalDelaySeconds = BuySignalStop * 60;
def SignalEnd = TradingDayEnd > EndSignalDelaySeconds;
def TradingDay = SignalStart and SignalEnd; #10:00EST - 1500EST
def LastStopDelaySeconds = LastCandleStop * 60;
def EndDay = TradingDayEnd == LastStopDelaySeconds; #1550EST
def TradingDayExt = TradingDayEnd > LastStopDelaySeconds;
##################################################################
# INDICATORS #
##################################################################
#200 EMA
plot EMA200 = ExpAverage(HL2, 200);
EMA200.SetDefaultColor(globalcolor("200EMA"));
EMA200.HideBubble();
EMA200.sethiding(!Show200EMA);
#EMAS
input Ema1Length = 5;
input Ema2Length = 12;
input Ema3Length = 34;
input Ema4Length = 50;
plot EMA1 = ExpAverage(close, Ema1Length);
EMA1.SetStyle(Curve.Short_Dash);
EMA1.SetDefaultColor(globalcolor("CloudUp"));
EMA1.HideBubble();
#EMA1.sethiding(!ShowFastEMALines);
plot EMA2 = ExpAverage(close, Ema2Length);
EMA2.SetDefaultColor(globalcolor("CloudDown"));
EMA2.HideBubble();
EMA2.sethiding(!ShowFastEMALines);
AddCloud(if ShowFastEMACloud then EMA1 else double.nan, if ShowFastEMACloud then EMA2 else double.nan, globalcolor("CloudUp"), globalcolor("CloudDown"));
plot EMA3 = ExpAverage(close, Ema3Length);
EMA3.SetDefaultColor(globalcolor("CloudUp"));
EMA3.HideBubble();
EMA3.sethiding(!ShowSlowEMALines);
plot EMA4 = ExpAverage(close, Ema4Length);
EMA4.SetDefaultColor(globalcolor("CloudDown"));
EMA4.HideBubble();
EMA4.sethiding(!ShowSlowEMALines);
AddCloud(if ShowSlowEMACloud then EMA3 else double.nan, if ShowSlowEMACloud then EMA4 else double.nan, globalcolor("CloudUp"), globalcolor("CloudDown"));
#EMAS BULLISH OR BEARISH
def EMABullish = EMA1 > EMA2;
def EMABearish = EMA1 < EMA2;
#EMA PERCENT SEPERATION
def EMAPctBull = ((EMA1 / EMA2) * 100) - 100; #Distance Between EMA1 and EMA2
def EMAPctBullRound = Round(EMAPctBull, 2);
def EMAPctBear = ((EMA2 / EMA1) * 100) - 100; #Distance Between EMA2 and EMA1
def EMAPctBearRound = Round(EMAPctBear, 2);
#FAST EMA PERCENT SEPERATION BUY SIGNAL
def EMASepThrHld;
switch (TimeFrame) {
case "1-min": EMASepThrHld = 0.1;
case "10-Min": EMASepThrHld = 0.25;
case "15-Min": EMASepThrHld = 0.25;
case "30-Min": EMASepThrHld = 0.3;
case "1-Hour": EMASepThrHld = 0.3;
default: EMASepThrHld = 0.2;
}
def EMAPctBullish = EMAPctBullRound > EMASepThrHld and EMAPctBullRound >= EMAPctBullRound[1];
def EMAPctBearish = EMAPctBearRound > EMASepThrHld and EMAPctBearRound >= EMAPctBearRound[1];
#TESTING
addchartbubble(ShowTestBubbles and EMAPctBullish, High * 1.005, EMAPctBullRound, color.dark_green, yes);
addchartbubble(ShowTestBubbles and EMAPctBearish, Low * 0.995, EMAPctBearRound, color.dark_red, no);
#EMA SELL SIGNALS
def EMACrossDown = EMA1 crosses below EMA2;
def EMACrossUp = EMA1 crosses above EMA2;
#TSI
input TSILongLength = 25;
input TSIShortLength = 13;
input TSISignalLength = 8;
def TSIDiff = close - close[1];
def DoubleSmoothedAbsDiff = ExpAverage(ExpAverage(AbsValue(TSIDiff), TSILongLength), TSIShortLength);
def TSIRound = Round((100 * (ExpAverage(ExpAverage(TSIDiff, TSILongLength), TSIShortLength)) / DoubleSmoothedAbsDiff), 2);
#TSI BUY SIGNAL
def TSIBull = (TSIRound > TSIRound[2]); #(TSIRound > 10)
def TSIBear = (TSIRound < TSIRound[2]); #(TSIRound < -10)
#TSI SELL SIGNAL
def TSICrossDown = TSIRound < (TSIRound[1] * 0.91);
def TSICrossUp = TSIRound > (TSIRound[1] * 0.91);
#MACD
input MACDFast = 10;
input MACDSlow = 22;
input MACDLength = 8;
def MACDValue = ExpAverage(close, MACDFast) - ExpAverage(close, MACDSlow);
def MACDAverage = ExpAverage(MACDValue, MACDLength);
def MACDDiff = MACDValue - MACDAverage;
def ZeroLine = 0;
#MACD BUY SIGNAL
def MACDBull = TSIRound > MACDAverage; #(MACDAverage > MACDAverage[1]) within 3 bars;
def MACDBear = TSIRound < MACDAverage; #(MACDAverage < MACDAverage[1]) within 3 bars;
#TSI AND MACD SELL SIGNAL
def TSIMACDLongSell = TSIRound crosses below MACDAverage;
def TSIMACDShortSell = TSIRound crosses above MACDAverage;
##################################################################
# PREMARKET #
##################################################################
#PREMARKET HIGHS AND LOWS
def PreMarketTimeRange = secondsFromTime(PreMarketStart) >= 0 and secondsTillTime(PreMarketEnd) >= 0;
def PreMarket = PreMarketTimeRange and !PremarketTimeRange[1];
def Pre_Market_High = compoundValue(1, if((high > Pre_Market_High[1] and PremarketTimeRange) or PreMarket, high, Pre_Market_High[1]), high);
def Pre_Market_Low = compoundValue(1, if((low < Pre_Market_Low[1] and PremarketTImeRange) or PreMarket, low, Pre_Market_Low[1]), low);
plot PreMarketHigh = Pre_Market_High;
PreMarketHigh.SetStyle(curve.short_dash);
PreMarketHigh.SetDefaultColor(color.light_gray);
PreMarketHigh.Sethiding(!ShowPreMarketLines);
plot PreMarketLow = Pre_Market_Low;
PreMarketLow.SetStyle(curve.short_dash);
PreMarketLow.SetDefaultColor(color.light_gray);
PreMarketLow.Sethiding(!ShowPreMarketLines);
AddCloud(if ShowPreMarketCloud then PreMarketHigh else double.nan, if ShowPreMarketCloud then PreMarketLow else double.nan, color.light_gray, color.light_gray);
AddLabel(if ShowPreMarketLabel then yes else no, " ", color.black);
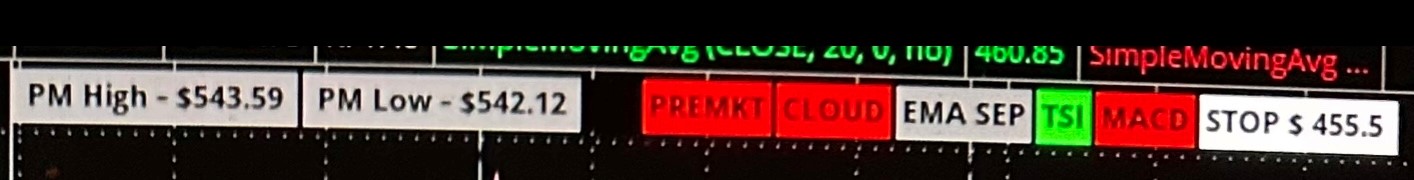
AddLabel(if ShowPreMarketLabel then yes else no, " PM High - $" + PreMarketHigh + " ", color.gray);
AddLabel(if ShowPreMArketLabel then yes else no, " PM Low - $" + PreMarketLow + " ", color.gray);
#PREMARKET HIGH/LOW BUY SIGNAL
def PreMarketBull = close > Pre_Market_High;
def PreMarketBear = close < Pre_Market_Low;
#PREMARKET HIGH/LOW SELL SIGNAL
def PreMarketBullSell = PreMarketBull[1] and low < Pre_Market_High;
def PreMarketBearSell = PreMarketBear[1] and high > Pre_Market_Low;
##################################################################
# YESTERDAY HIGH/LOW #
##################################################################
plot PrevHigh = high(period = "day")[1];
PrevHigh.SetStyle(curve._dash);
PrevHigh.SetDefaultColor(Color.GREEN);
PrevHigh.Sethiding(!ShowPrevDayLines);
plot PrevLow = low(period = "day")[1];
PrevLow.SetStyle(curve._dash);
PrevLow.SetDefaultColor(Color.GREEN);
PrevLow.Sethiding(!ShowPrevDayLines);
AddCloud(if ShowPrevDayCloud then PrevHigh else double.nan, if ShowPrevDayCloud then PrevLow else double.nan, color.light_gray, color.light_gray);
AddLabel(if ShowPrevHighLowLabel then 1 else 0, " ", color.black);
AddLabel(if ShowPrevHighLowLabel then 1 else 0, "Prev High " + "$ " + PrevHigh + " ", color.gray);
AddLabel(if ShowPrevHighLowLabel then 1 else 0, "Prev Low " + "$ " + PrevLow + " ", color.gray);
##################################################################
# SIGNALS #
##################################################################
#INDICATOR BUY SIGNALS
def LongBuyInd = TradingDay and EMABullish and EMAPctBullish and MACDBull and TSIBull and PreMarketBull;
def ShortBuyInd = TradingDay and EMABearish and EMAPctBearish and MACDBear and TSIBear and PreMarketBear;
plot LongEntryLine = if (LongBuyInd[1] or LongBuyInd[2]) and ShowDashes and LongBuyInd then EMA1[1] * 1.0025 else double.nan;
LongEntryLine.SetPaintingStrategy(PaintingStrategy.Dashes);
LongEntryLine.SetDefaultColor(color.white);
LongEntryLine.SetLineWeight(3);
plot ShortEntryLine = if (ShortBuyInd[1] or ShortBuyInd[2]) and ShowDashes and ShortBuyInd then EMA1[1] * 0.9975 else double.nan;
ShortEntryLine.SetPaintingStrategy(PaintingStrategy.Dashes);
ShortEntryLine.SetDefaultColor(color.white);
ShortEntryLine.SetLineWeight(3);
#INDICATOR ENTRY SIGNALS
def LongEntryInd = (LongBuyInd[1] or LongBuyInd[2]) and LongBuyInd and low <= (EMA1 * 1.0025);
def ShortEntryInd = (ShortBuyInd[1] or ShortBuyInd[2]) and ShortBuyInd and high >= (EMA1 * 0.9975);
#INDICATOR HOLD SIGNALS
def LongHoldInd = TradingDayExt and PreMarketBull and (LongBuyInd[1] or LongHoldInd[1]);
def ShortHoldInd = TradingDayExt and PreMarketBear and (ShortBuyInd[1] or ShortHoldInd[1]);
##################################################################
# ADDED FAST EMA PCT HERE BASED OFF BUY SIGNAL #
##################################################################
def EMAPctAtLongBuy = if LongEntryInd then EMAPctBullRound else EMAPctAtLongBuy[1];
def EMAPctAtShortBuy = if ShortEntryInd then EMAPctBearRound else EMAPctAtShortBuy[1];
#FAST EMA CLOUD SELL TRIGGER BASED OFF BUY INDICATOR
input EMAPctDecFromBuy = 0.6;
def LongEMAPctSell = EMAPctBullRound < (EMAPctAtLongBuy * EMAPctDecFromBuy);
def ShortEMAPctSell = EMAPctBearRound < (EMAPctAtShortBuy * EMAPctDecFromBuy);
##################################################################
# SIGNALS CONT. #
##################################################################
#SELL SIGNALS
def LongPriceActSell = low < low[4];
def ShortPriceActSell = high > high[4];
def LongSellInd = TradingDayExt and (close < open) and close < EMA1 and LongPriceActSell and close < EMA2 and (EMACrossDown or TSICrossDown or LongEMAPctSell or TSIMACDLongSell);
def ShortSellInd = TradingDayExt and (close > open) and close > EMA1 and ShortPriceActSell and close > EMA2 and (EMACrossUp or TSICrossUp or ShortEMAPctSell or TSIMACDShortSell);
#TESTING
addchartbubble(ShowTestBubbles and TSICrossDown, High * 1.005, "T-Dn", color.dark_green, yes);
addchartbubble(ShowTestBubbles and TSICrossUp, Low * 0.995, "T-Up", color.dark_red, no);
addchartbubble(ShowTestBubbles and EMACrossDown, High * 1.005, "E-X-Dn", color.dark_green, yes);
addchartbubble(ShowTestBubbles and EMACrossUp, Low * 0.995, "E-X-Up", color.dark_red, no);
addchartbubble(ShowTestBubbles and LongEMAPctSell, High * 1.005, "E-Pct-Dn", color.dark_green, yes);
addchartbubble(ShowTestBubbles and SHortEMAPctSell, Low * 0.995, "E-Pct-Up", color.dark_red, no);
#HOLD SIGNALS
def LongHoldInd2 = LongHoldInd and !LongSellInd;
def ShortHoldInd2 = ShortHoldInd and !ShortSellInd;
##################################################################
# BARS #
##################################################################
AssignPriceColor(if LongBuyInd then GlobalColor("OpenLongPosition") else if ShortBuyInd then GlobalColor("OpenShortPosition") else if LongHoldInd2 then GlobalColor("HoldLongPosition") else if ShortHoldInd2 then GlobalColor("HoldShortPosition") else GlobalColor("CriteriaNotMet"));
##################################################################
# EMA TAKE PROFIT CLOUD (IDENTIFY IF PRICE IS EXTENDED FROM EMAS)#
##################################################################
def OvrExtUp1 = if ShowOverExtCloud and SignalStart and TradingDayExt and (LongEntryInd or LongHoldInd2) then EMA1 * 1.01 else Double.NaN;
def OvrExtUp2 = if ShowOverExtCloud and SignalStart and TradingDayExt and (LongEntryInd or LongHoldInd2) then EMA1 * 1.02 else Double.NaN;
AddCloud(OvrExtUp1, OvrExtUp2, color.light_green, color.light_green);
def OvrExtDn1 = if ShowOverExtCloud and SignalStart and TradingDayExt and (ShortEntryInd or ShortHoldInd2) then EMA1 * 0.99 else Double.NaN;
def OvrExtDn2 = if ShowOverExtCloud and SignalStart and TradingDayExt and (ShortEntryInd or ShortHoldInd2) then EMA1 * 0.98 else Double.NaN;
AddCloud(OvrExtDn1, OvrExtDn2, color.light_green, color.light_green);
##################################################################
# LABELS #
##################################################################
#LABELS
AddLabel(yes, " ", color.black);
AddLabel(yes, "PREMKT", if PreMarketBull then GlobalColor("OpenLongPosition") else if PreMarketBear then GlobalColor("OpenShortPosition") else color.gray);
AddLabel(yes, "CLOUD", if EMABullish then GlobalColor("OpenLongPosition") else if EMABearish then GlobalColor("OpenShortPosition") else color.gray);
AddLabel(yes, "EMA SEP", if EMAPctBullish then GlobalColor("OpenLongPosition") else if EMAPctBearish then GlobalColor("OpenShortPosition") else color.gray);
AddLabel(yes, "TSI", if TSIBull then GlobalColor("OpenLongPosition") else if TSIBear then GlobalColor("OpenShortPosition") else color.gray);
AddLabel(yes, "MACD", if MACDBull then GlobalColor("OpenLongPosition") else if MACDBear then GlobalColor("OpenShortPosition") else color.gray);
##################################################################
# CHART BUBBLES/POINTS FOR BUY/SELL #
##################################################################
#BUY
def LongBuyBub = LongEntryInd;
addchartbubble(ShowBuySellBubbles and LongBuyBub, High * 1.005, "Long", color.green, yes);
def ShortBuyBub = ShortEntryInd;
addchartbubble(ShowBuySellBubbles and ShortBuyBub, Low * 0.995, "Short", color.red, no);
plot LongBuyPoint = if ShowArrows and LongBuyBub then EMA1[1] else double.nan;
LongBuyPoint.SetDefaultColor(color.white);
LongBuyPoint.SetPaintingStrategy(PaintingStrategy.Arrow_Up);
LongBuyPoint.SetLineWeight(5);
LongBuyPoint.HideBubble();
plot ShortBuyPoint = if ShowArrows and ShortBuyBub then EMA1[1] else double.nan;
ShortBuyPoint.SetDefaultColor(color.white);
ShortBuyPoint.SetPaintingStrategy(PaintingStrategy.Arrow_Down);
ShortBuyPoint.SetLineWeight(5);
ShortBuyPoint.HideBubble();
#SELL
def LongSellBub = (LongEntryInd[1] or LongHoldInd2[1]) and (LongEntryInd[2] or LongHoldInd2[2]) and LongSellInd;
addchartbubble(ShowBuySellBubbles and LongSellBub, High * 1.005, "Sell", color.red, yes);
def ShortSellBub = (ShortEntryInd[1] or ShortHoldINd2[1]) and (ShortEntryInd[2] or ShortHoldINd2[2]) and ShortSellInd;
addchartbubble(ShowBuySellBubbles and ShortSellBub, Low * 0.995, "Sell", color.green, no);
plot LongSellPoint = if ShowSquares and LongSellBub then Close else double.nan;
LongSellPoint.SetDefaultColor(color.red);
LongSellPoint.SetPaintingStrategy(PaintingStrategy.Squares);
LongSellPoint.SetLineWeight(5);
LongSellPoint.HideBubble();
plot ShortSellPoint = if ShowSquares and ShortSellBub then Close else double.nan;
ShortSellPoint.SetDefaultColor(color.green);
ShortSellPoint.SetPaintingStrategy(PaintingStrategy.Squares);
ShortSellPoint.SetLineWeight(5);
ShortSellPoint.HideBubble();
#TAKE PROFIT
def LongTkPftBub = TradingDayExt and (LongEntryInd or LongHoldInd2) and high > EMA1 * 1.01;
addchartbubble(ShowTkPftBubble and LongTkPftBub, high * 1.001, "Tk Pft", GlobalColor("TakeProfit"), yes);
def ShortTkPftBub = TradingDayExt and (ShortEntryInd or ShortHoldInd2) and low < EMA1 * 0.99;
addchartbubble(ShowTkPftBubble and ShortTkPftBub, low * 0.999, "Tk Pft", GlobalColor("TakeProfit"), no);
plot LongTkPftPoint = if ShowBooleanArrows and LongTkPftBub then High else double.nan;
LongTkPftPoint.SetDefaultColor(GlobalColor("TakeProfit"));
LongTkPftPoint.SetPaintingStrategy(PaintingStrategy.Boolean_Wedge_Up);
LongTkPftPoint.SetLineWeight(5);
LongTkPftPoint.HideBubble();
plot ShortTkPftPoint = if ShowBooleanArrows and ShortTkPftBub then Low else double.nan;
ShortTkPftPoint.SetDefaultColor(GlobalColor("TakeProfit"));
ShortTkPftPoint.SetPaintingStrategy(PaintingStrategy.Boolean_Wedge_Down);
ShortTkPftPoint.SetLineWeight(5);
ShortTkPftPoint.HideBubble();
##################################################################
# STOP LOSS #
##################################################################
def longstop = if (open < close) then open else close;
def shortstop = if (open > close) then open else close;
addlabel(if (LongBuyInd or LongHoldInd2) then yes else no, "STOP $ " + longstop[4] + " ", color.white);
addlabel(if (ShortBuyInd or ShortHoldInd2) then yes else no, "STOP $ " + shortstop[4] + " ", color.white);
##################################################################
# ORDERS #
##################################################################
def orderQuantity = Round(10000 / open, 0);
#BUY ORDERS
AddOrder(OrderType.BUY_TO_OPEN, ShowOrders and LongEntryInd, EMA1 * 1.0025, 100, Color.GREEN, Color.LIGHT_GREEN);
AddOrder(OrderType.SELL_TO_OPEN, ShowOrders and ShortEntryInd, EMA1 * 0.9975, 100, Color.GREEN, Color.LIGHT_GREEN);
#SELL ORDERS
AddOrder(OrderType.SELL_TO_CLOSE, ShowOrders and ShowTkPftOrders and LongTkPftBub, high * 0.999, 100, Color.RED, Color.LIGHT_RED);
AddOrder(OrderType.SELL_TO_CLOSE, ShowOrders and (LongSellInd or EndDay[-1]), open[-1], 100, Color.RED, Color.LIGHT_RED);
AddOrder(OrderType.BUY_TO_CLOSE, ShowOrders and ShowTkPftOrders and ShortTkPftBub, low * 1.001, 100, Color.RED, Color.LIGHT_RED);
AddOrder(OrderType.BUY_TO_CLOSE, ShowOrders and (ShortSellInd or EndDay[-1]), open[-1], 100, Color.RED, Color.LIGHT_RED);
##################################################################
# ALERTS #
##################################################################
Alert(AlertOn and (LongSellBub or ShortSellBub or LongTkPftBub or ShortTkPftBub), "SELL" + GetSymbol(), Alert.BAR, Sound.Bell);
Alert(AlertOn and (LongBuyInd or ShortBuyInd), "BUY" + GetSymbol(), Alert.BAR, Sound.Chimes);
##################################################################
# CANDLE COLOR LABEL #
##################################################################
AddLabel(if ShowColorDefLabels == 1 then yes else no, " ", color.black);
AddLabel(if ShowColorDefLabels == 1 then yes else no, "Long Ind", GlobalColor("OpenLongPosition"));
AddLabel(if ShowColorDefLabels == 1 then yes else no, "Long Hld", GlobalColor("HoldLongPosition"));
AddLabel(if ShowColorDefLabels == 1 then yes else no, "Short Ind", GlobalColor("OpenShortPosition"));
AddLabel(if ShowColorDefLabels == 1 then yes else no, "Short Hld", GlobalColor("HoldShortPosition"));
AddLabel(if ShowColorDefLabels == 1 then yes else no, "No Criteria", GlobalColor("CriteriaNotMet"));
##################################################################
# BACKGROUND COLOR FOR FLEX GRID #
##################################################################
AssignBackgroundColor(if ShowFlexGridBackgroundColor and LongBuyInd then GlobalColor("OpenLongPosition") else if ShowFlexGridBackgroundColor and ShortBuyInd then GlobalColor("OpenShortPosition") else if ShowFlexGridBackgroundColor and (LongTkPftBub or ShortTkPftBub) then GlobalColor("TakeProfit") else color.current);
And last but not least, my watchlist indicator. I only use this to visually tell me when to take a closer look at a stock. I have whittled down my watchlist to ones that I know move and have plenty of options flow. Make sure your watchlist study is set to 5 Min and Extended Hours are turned On.
The numbers mean nothing. It is just my way of sorting. You can change the labels to whatever you want in the bottom of the code under “Label”
You will only get a signal on the chart and the watchlist between 8:35 A.M. CST and 2:55 P.M. CST.
Code:
#JT Newest Strategy Based on EMAs, TSI, Premarket Highs/Lows, and MACD
#VERSION 10.3 - 05/26/2022

#Notes

##################################################################
#                                 TIMES                          #
##################################################################
#START AND END TIMES
def PreMarketStart = 0700; #EST
def PreMarketEnd = 0929; #EST
def StartTime = 0930; #EST
def BuySignalDelay = 0;
def EndTime = 1600; #EST
def BuySignalStop = 60; #Minutes Before End of Day
def LastCandleStop = 5; #Last Candle is Sell Candle


def TradingDayStart= SecondsFromTime(StartTime);
def BuySignalDelaySeconds = BuySignalDelay * 60;
def SignalStart = TradingDayStart > BuySignalDelaySeconds;
def TradingDayEnd = SecondsTillTime(EndTime);
def EndSignalDelaySeconds = BuySignalStop * 60;
def SignalEnd = TradingDayEnd > EndSignalDelaySeconds;
def TradingDay = SignalStart and SignalEnd; #10:00EST - 1500EST
def LastStopDelaySeconds = LastCandleStop * 60;
def EndDay = TradingDayEnd == LastStopDelaySeconds; #1550EST
def TradingDayExt = TradingDayEnd > LastStopDelaySeconds;

##################################################################
#                              INDICATORS                        #
##################################################################
#200 EMA
def EMA200 = ExpAverage(HL2, 200);

#EMAS
def Ema1Length = 5;
def Ema2Length = 12;

def EMA1 = ExpAverage(close, Ema1Length);
def EMA2 = ExpAverage(close, Ema2Length);

    #EMAS BULLISH OR BEARISH
    def EMABullish = EMA1 > EMA2;
    def EMABearish = EMA1 < EMA2;

        #EMA PERCENT SEPERATION
        def EMAPctBull = ((EMA1 / EMA2) * 100) - 100; #Distance Between EMA1 and EMA2
        def EMAPctBullRound = Round(EMAPctBull, 2);
        def EMAPctBear = ((EMA2 / EMA1) * 100) - 100; #Distance Between EMA2 and EMA1
        def EMAPctBearRound = Round(EMAPctBear, 2);

        def EMAPctBullish = EMAPctBullRound > 0.2 and EMAPctBullRound >= EMAPctBullRound[1];
        def EMAPctBearish = EMAPctBearRound > 0.2 and EMAPctBearRound >= EMAPctBearRound[1];

            #EMA SELL SIGNALS
            def EMACrossDown = EMA1 crosses below EMA2;
            def EMACrossUp = EMA1 crosses above EMA2;

#TSI
def TSILongLength = 25;
def TSIShortLength = 13;
def TSISignalLength = 8;

def TSIDiff = close - close[1];
def DoubleSmoothedAbsDiff = ExpAverage(ExpAverage(AbsValue(TSIDiff), TSILongLength), TSIShortLength);
def TSIRound = Round((100 * (ExpAverage(ExpAverage(TSIDiff, TSILongLength), TSIShortLength)) / DoubleSmoothedAbsDiff), 2);

    #TSI BUY SIGNAL
    def TSIBull = (TSIRound > TSIRound[2]); #(TSIRound > 10)
    def TSIBear = (TSIRound < TSIRound[2]); #(TSIRound < -10)

        #TSI SELL SIGNAL
        def TSICrossDown = TSIRound < (TSIRound[1] * 0.91);
        def TSICrossUp = TSIRound > (TSIRound[1] * 0.91);

#MACD
def MACDFast = 10;
def MACDSlow = 22;
def MACDLength = 8;

def MACDValue = ExpAverage(close, MACDFast) - ExpAverage(close, MACDSlow);
def MACDAverage = ExpAverage(MACDValue, MACDLength);
def MACDDiff = MACDValue - MACDAverage;
def ZeroLine = 0;

    #MACD BUY SIGNAL
    def MACDBull = TSIRound > MACDAverage; #(MACDAverage > MACDAverage[1]) within 3 bars;
    def MACDBear = TSIRound < MACDAverage; #(MACDAverage < MACDAverage[1]) within 3 bars;

#TSI AND MACD SELL SIGNAL
def TSIMACDLongSell = TSIRound crosses below MACDAverage;
def TSIMACDShortSell = TSIRound crosses above MACDAverage;

##################################################################
#                          PREMARKET                             #
##################################################################
#PREMARKET HIGHS AND LOWS
def PreMarketTimeRange = secondsFromTime(PreMarketStart) >= 0 and secondsTillTime(PreMarketEnd) >= 0;
def PreMarket = PreMarketTimeRange and !PremarketTimeRange[1];
def Pre_Market_High = compoundValue(1, if((high > Pre_Market_High[1] and PremarketTimeRange) or PreMarket, high, Pre_Market_High[1]), high);
def Pre_Market_Low = compoundValue(1, if((low < Pre_Market_Low[1] and PremarketTImeRange) or PreMarket, low, Pre_Market_Low[1]), low);

def PreMarketHigh = Pre_Market_High;
def PreMarketLow = Pre_Market_Low;

    #PREMARKET HIGH/LOW BUY SIGNAL
    def PreMarketBull = close > Pre_Market_High;
    def PreMarketBear = close < Pre_Market_Low;

        #PREMARKET HIGH/LOW SELL SIGNAL
        def PreMarketBullSell = PreMarketBull[1] and low < Pre_Market_High;
        def PreMarketBearSell = PreMarketBear[1] and high > Pre_Market_Low;

##################################################################
#                               SIGNALS                          #
##################################################################
#INDICATOR BUY SIGNALS
def LongBuyInd = TradingDay and EMABullish and EMAPctBullish and MACDBull and TSIBull and PreMarketBull;
def ShortBuyInd = TradingDay and EMABearish and EMAPctBearish and MACDBear and TSIBear and PreMarketBear;

#INDICATOR ENTRY SIGNALS
def LongEntryInd = (LongBuyInd[1] or LongBuyInd[2]) and LongBuyInd and low <= (EMA1 * 1.0025);
def ShortEntryInd = (ShortBuyInd[1] or ShortBuyInd[2]) and ShortBuyInd and high >= (EMA1 * 0.9975);

#INDICATOR HOLD SIGNALS
def LongHoldInd = TradingDayExt and PreMarketBull and (LongBuyInd[1] or LongHoldInd[1]);
def ShortHoldInd = TradingDayExt and PreMarketBear and (ShortBuyInd[1] or ShortHoldInd[1]);

##################################################################
#         ADDED FAST EMA PCT HERE BASED OFF BUY SIGNAL           #
##################################################################
            def EMAPctAtLongBuy = if LongEntryInd then EMAPctBullRound else EMAPctAtLongBuy[1];
            def EMAPctAtShortBuy = if ShortEntryInd then EMAPctBearRound else EMAPctAtShortBuy[1];

                #FAST EMA CLOUD SELL TRIGGER BASED OFF BUY INDICATOR
                def LongEMAPctSell = EMAPctBullRound < (EMAPctAtLongBuy * 0.6);
                def ShortEMAPctSell = EMAPctBearRound < (EMAPctAtShortBuy * 0.6);

##################################################################
#                         SIGNALS CONT.                          #
##################################################################
    #SELL SIGNALS
    def LongPriceActSell = low < low[4];
    def ShortPriceActSell = high > high[4];
    def LongSellInd = TradingDayExt and (close < open) and (EMACrossDown or TSICrossDown or LongEMAPctSell or LongPriceActSell or TSIMACDLongSell);
    def ShortSellInd = TradingDayExt and (close > open) and (EMACrossUp or TSICrossUp or ShortEMAPctSell or ShortPriceActSell or TSIMACDShortSell);

    #HOLD SIGNALS
    def LongHoldInd2 = LongHoldInd and !LongSellInd;
    def ShortHoldInd2 = ShortHoldInd and !ShortSellInd;

##################################################################
#               CHART BUBBLES/POINTS FOR BUY/SELL                #
##################################################################
#TAKE PROFIT
def LongTkPftBub = TradingDayExt and (LongEntryInd or LongHoldInd2) and high > EMA1 * 1.01;
def ShortTkPftBub = TradingDayExt and (ShortEntryInd or ShortHoldInd2) and low < EMA1 * 0.99;

##################################################################
#                        WATCHLIST INDICATOR                     #
##################################################################

#LABEL
AddLabel(yes, if LongBuyInd then "1. LONG" else if LongHoldInd2 then "4. LONG HOLD" else if ShortBuyInd then "2. SHORT" else if ShortHoldInd2 then "5. SHORT HOLD" else if LongTkPftBub or ShortTkPftBub then "3. TAKE PROFIT" else "6. NO GO");

#BACKGROUND
AssignBackgroundColor(if LongBuyInd then createcolor (0, 255, 0) else if LongHoldInd2 then createcolor (153, 255, 153) else if ShortBuyInd then createcolor (255, 0, 0) else if ShortHoldInd2 then createcolor (255, 153, 153) else if LongTkPftBub or ShortTkPftBub then createcolor (255, 0, 255) else createcolor (102, 102, 102));
What can go wrong….?
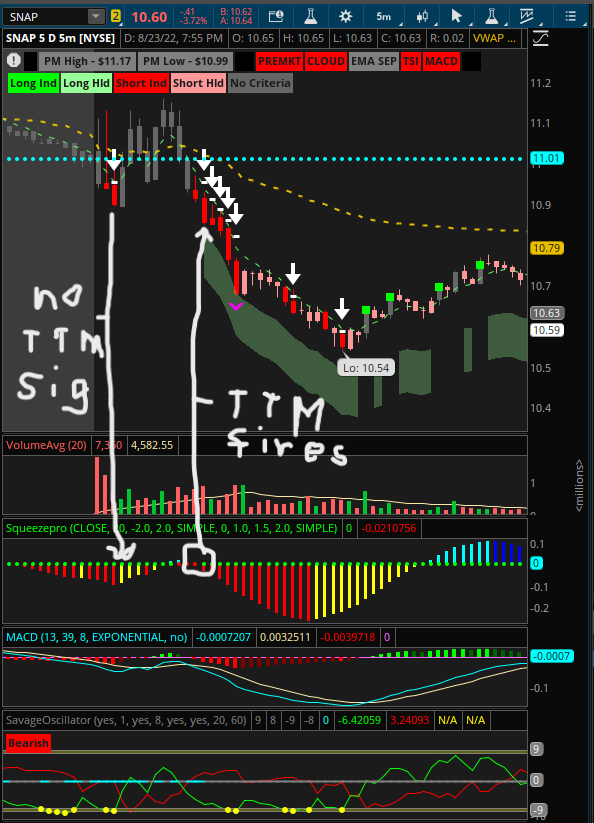
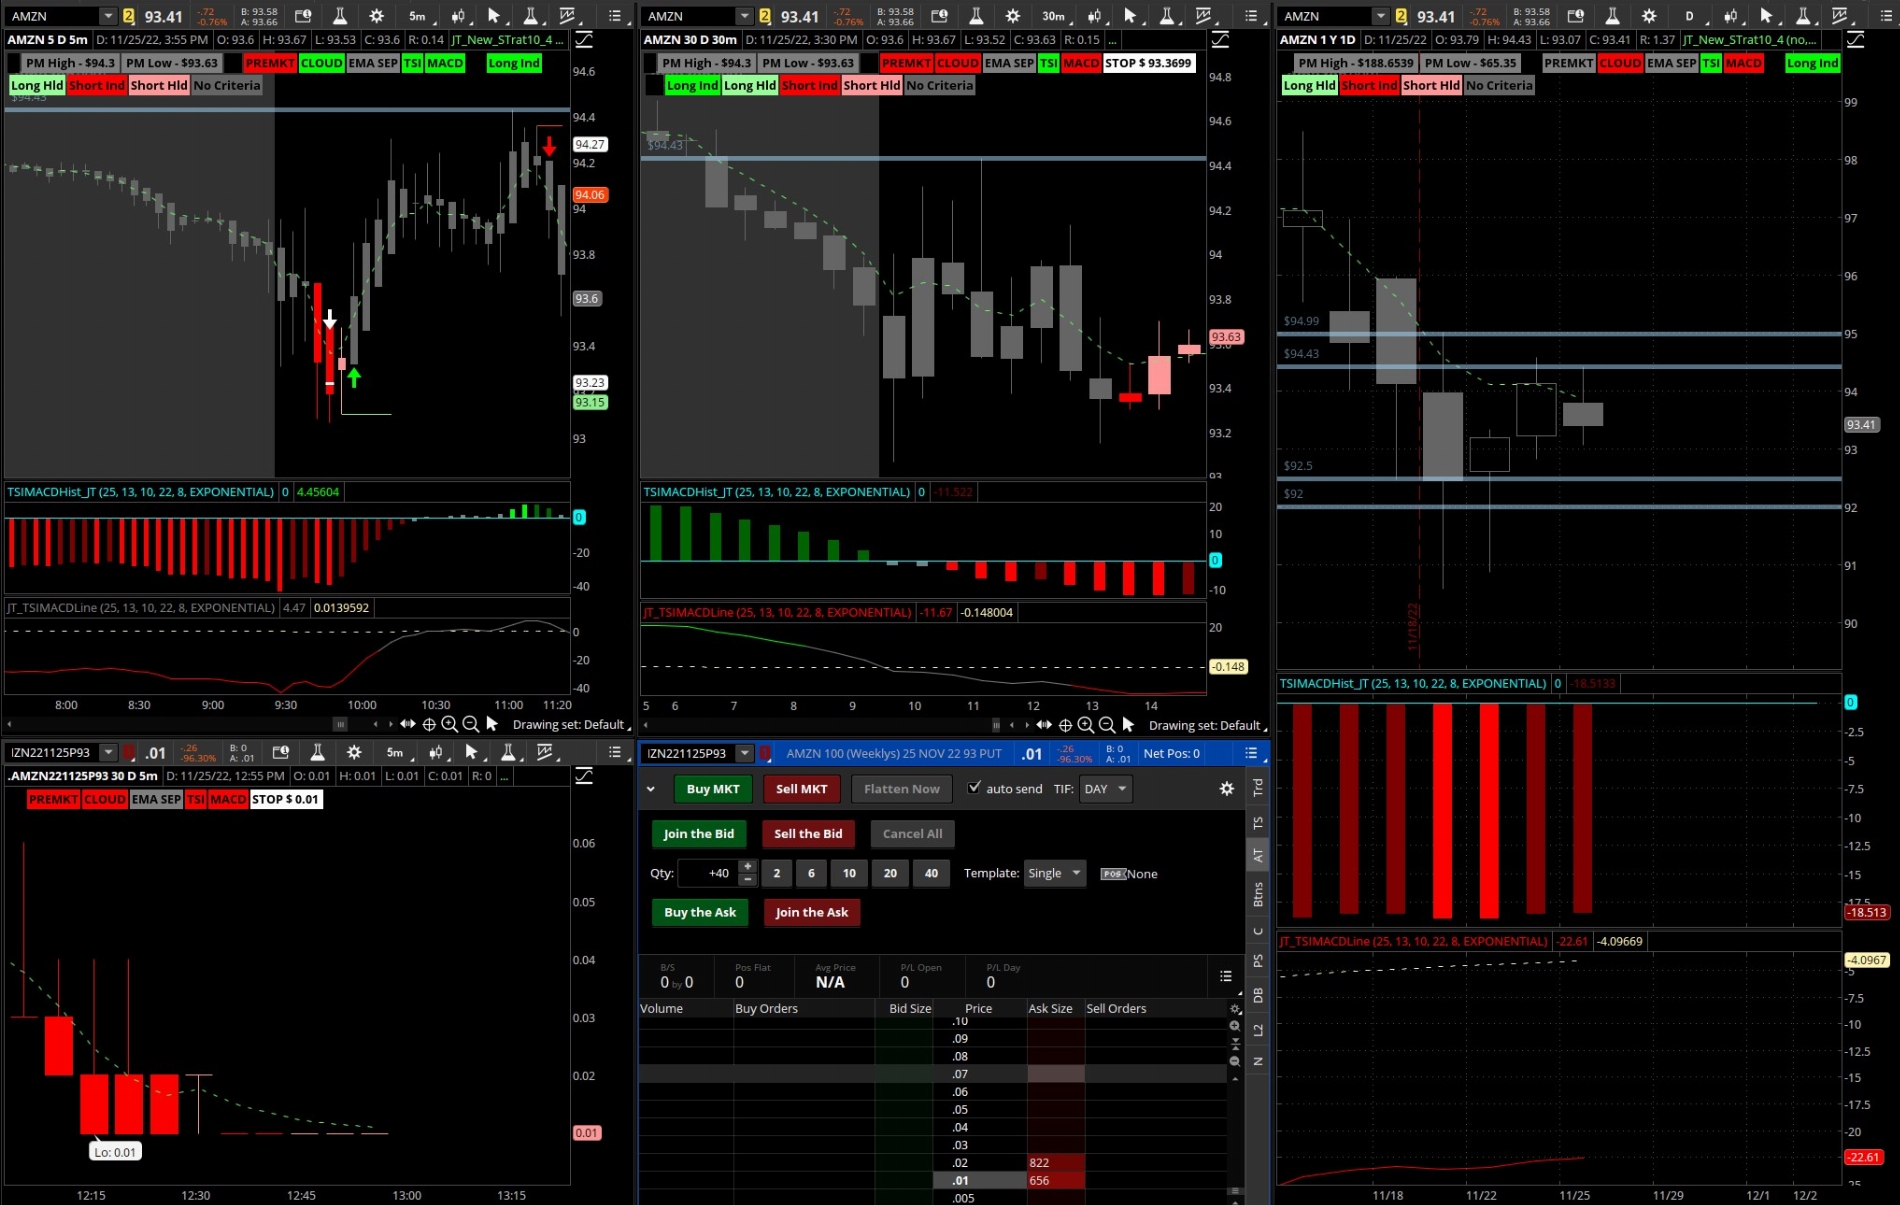
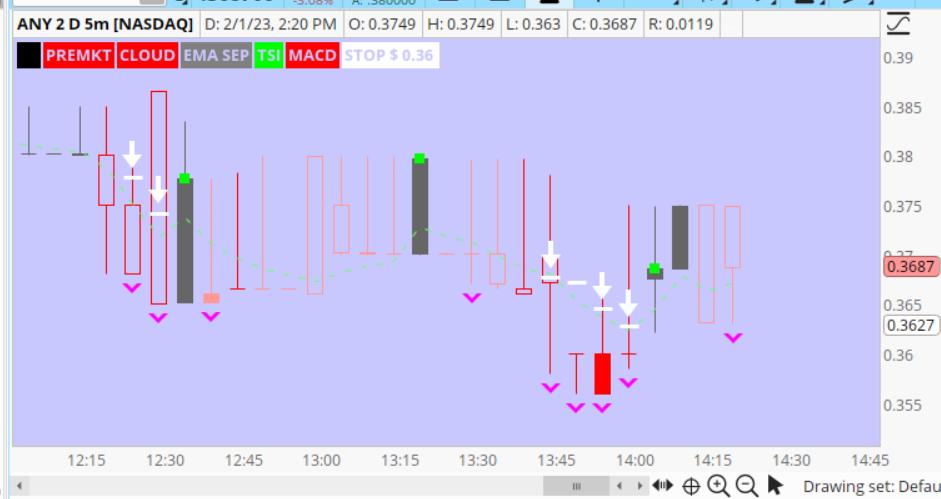
See the chart below. You will notice green candles which means all criteria to buy are met EXCEPT the price being within the defined range of the 5EMA. Because the price is extended, you didn’t get a white arrow. If you FOMO’d in, get out on the pink boolean arrow. You will notice after 5 minutes the price sharply reverses down and below the 5EMA. The price eventually normalizes and starts a gradual uptrend. You would do your best to enter on the candle with the white arrow, as close as possible to the 5EMA and definitely below the white dash. You would then wait for a grey candle to completely close and then exit at the open of the following candle.
I didn’t just pull that over extended cloud out of nowhere. That was me looking at multiple charts and coming up with the best number (probably has something to do with other algos).
To the right is what it’s supposed to look like.
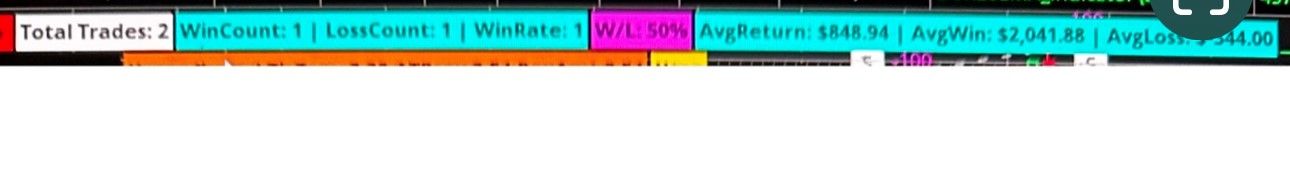
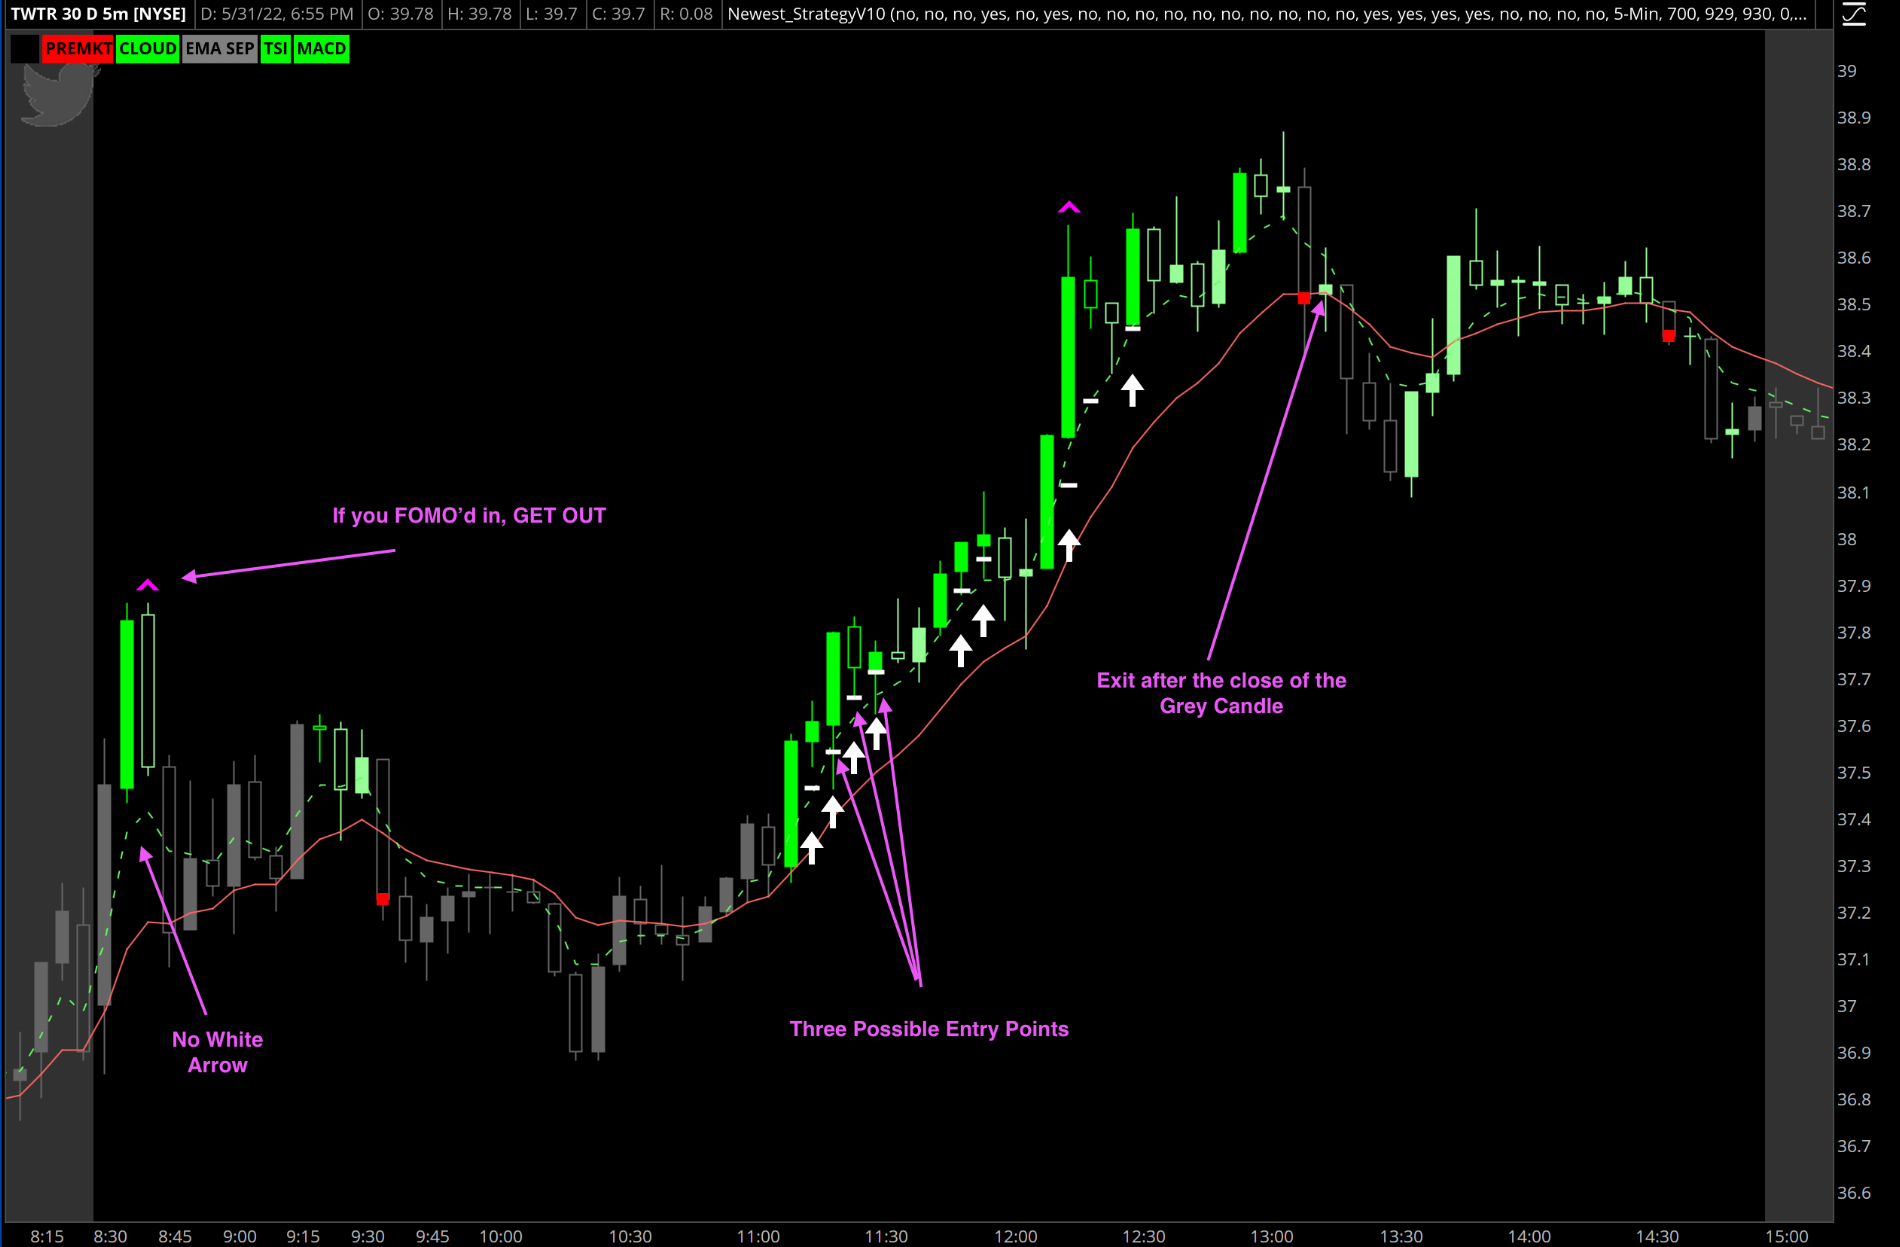
Some light backtesting here. This is over 90 days and BEFORE I backtested with the pink boolean arrows.
If you happen to have something of value to add please don’t hesitate to post that here. This is however about 6 months of trial and error in the making.
###################################################################################
This is how I trade personally. Do whatever you want with this information.
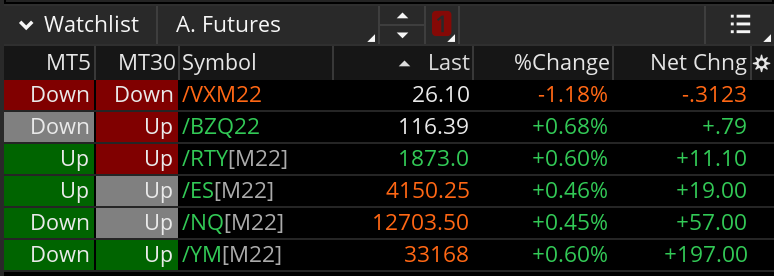
Step 1. Before pre-market opens if I am awake. I look at the futures to get an idea of the direction of the market and VIX futures. So I am following the rules of the site. Here are the links to the two watchlist columns below. Not pertinent at this point. MT5 - http://tos.mx/4hzwiEn MT30 - http://tos.mx/45R1EOH
Step 2. Look at my watchlist throughout the premarket to get an idea on what is running or what sectors may be in play. This comes with experience. I am strictly looking at percent gain or percent loss.
Step 3. Pick a few stocks that I think I want to trade. That may be based on news, pre-market action, recent earnings, some Elon Must Twitter post etc. I want something that is going to move! I would highly prefer that it move with the sector and with the futures and/or index it’s trading in.
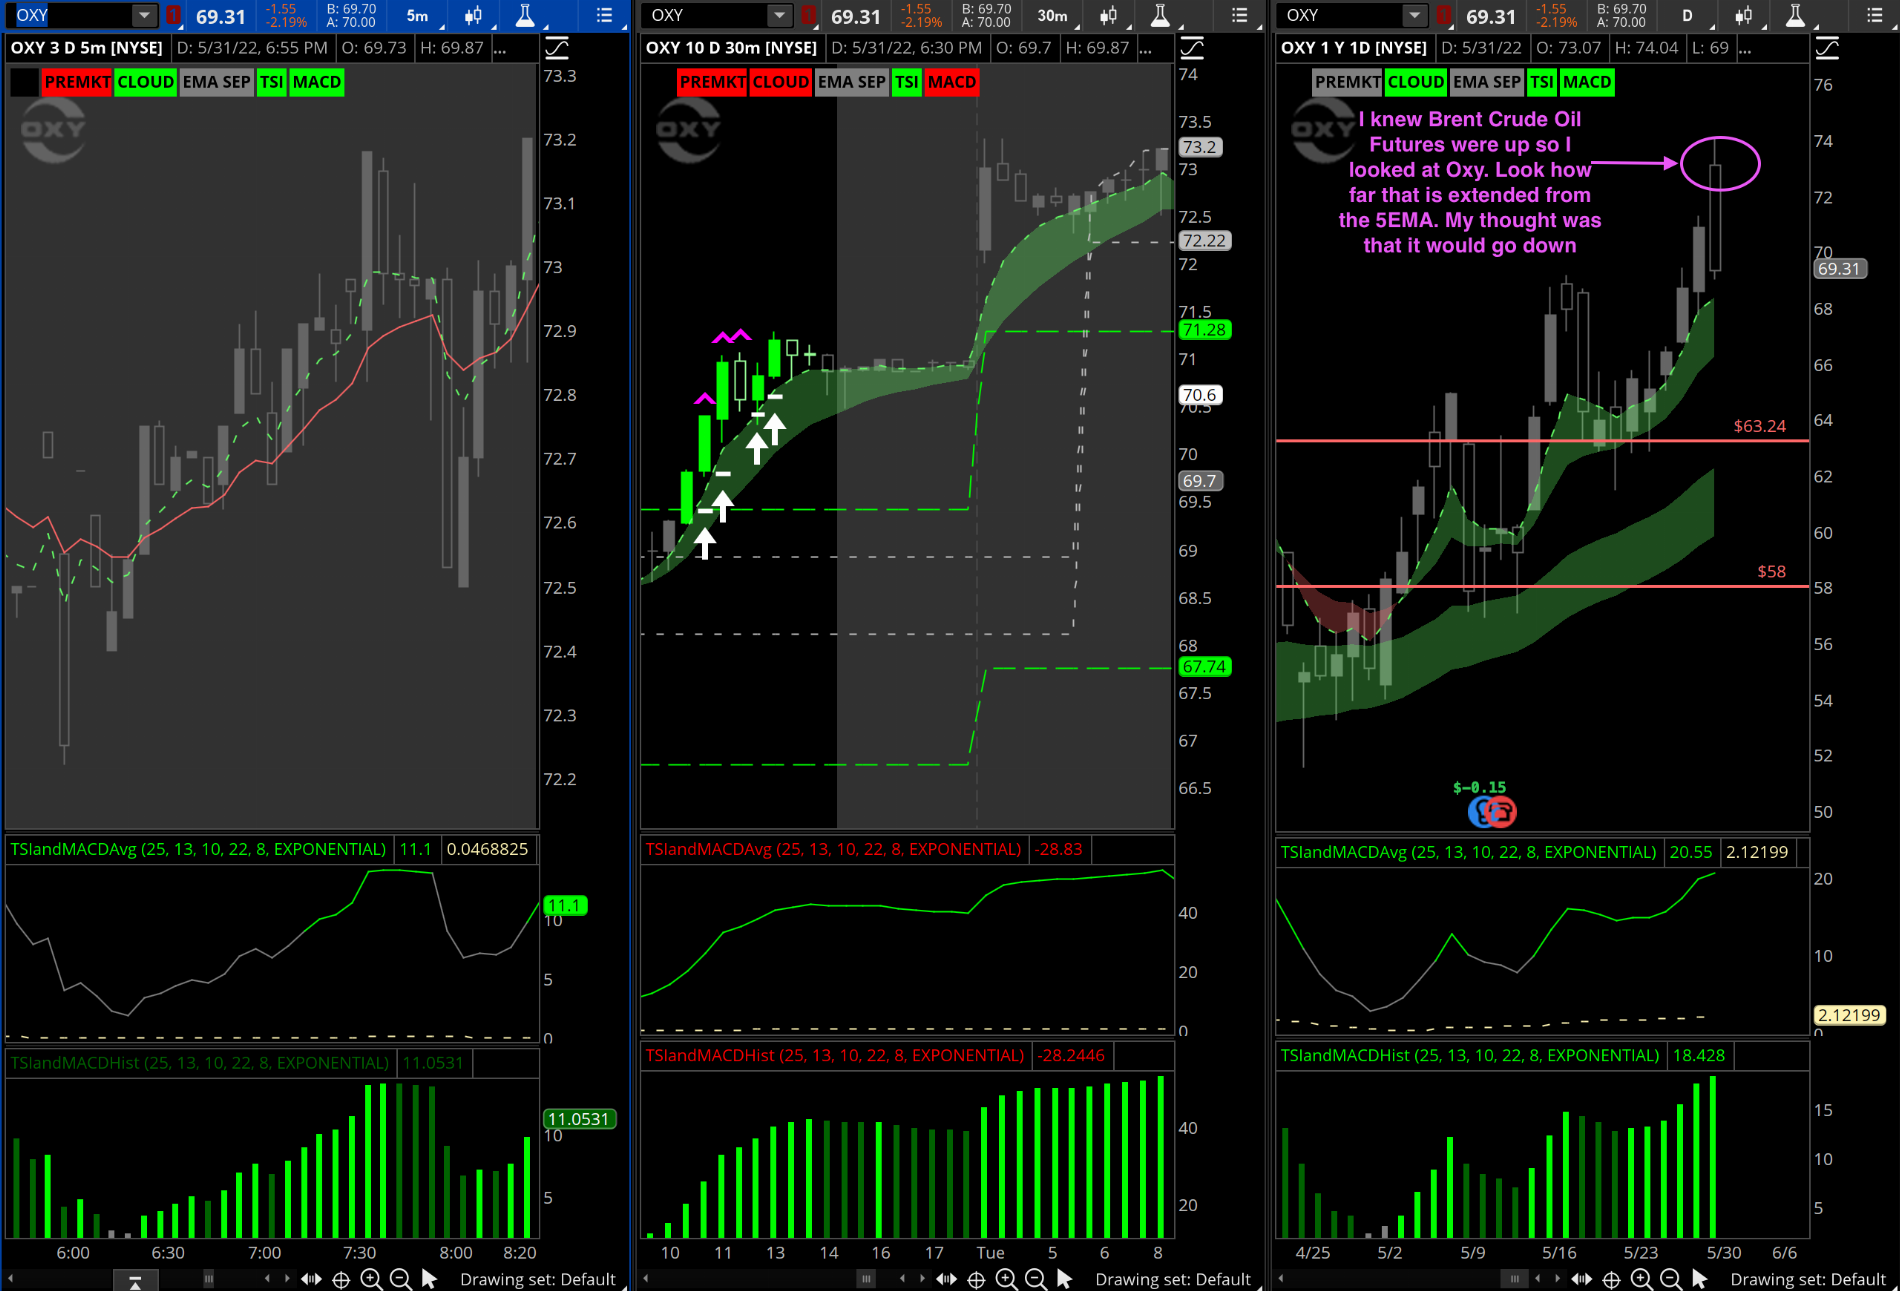
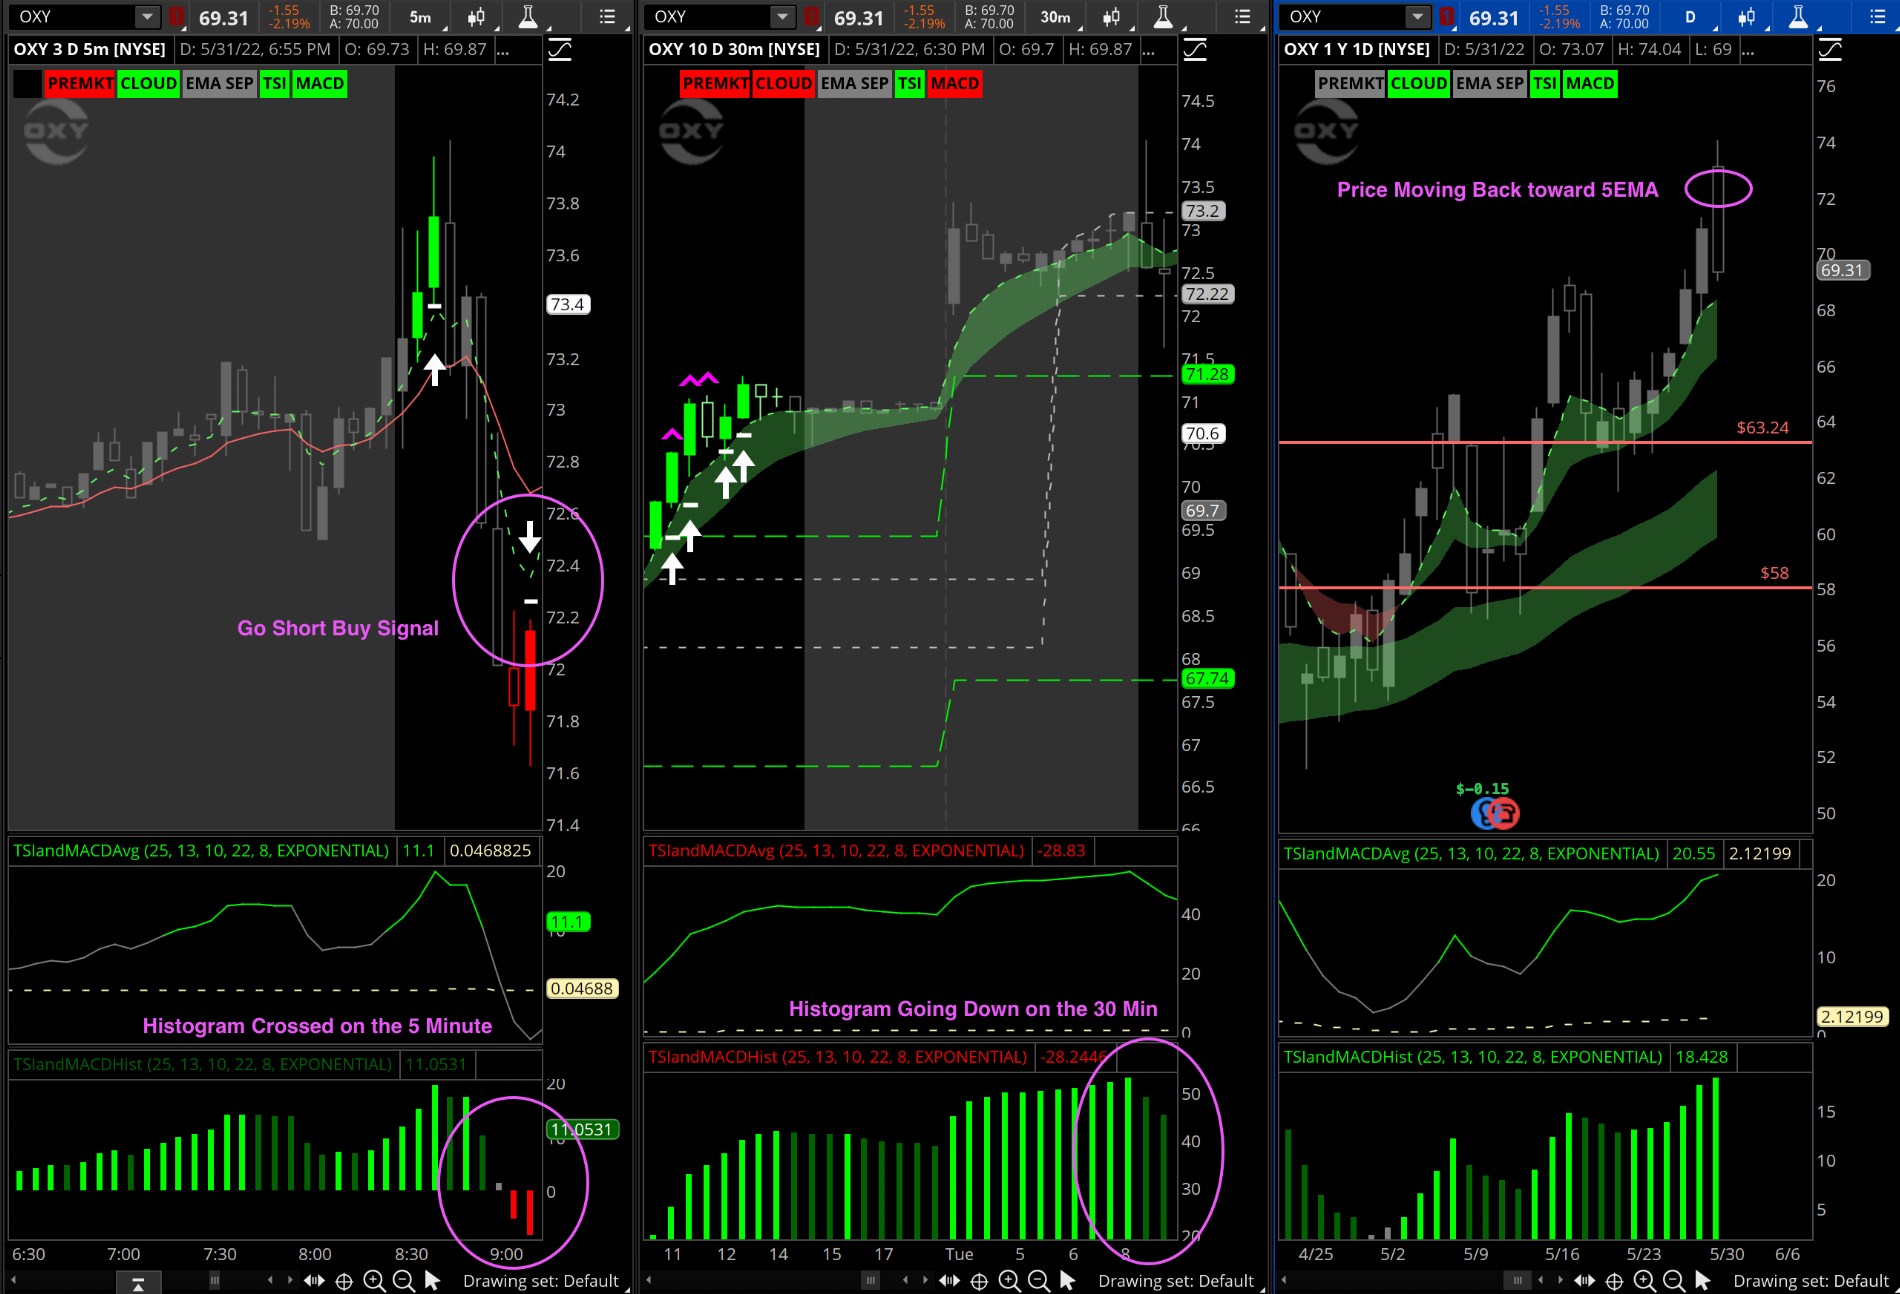
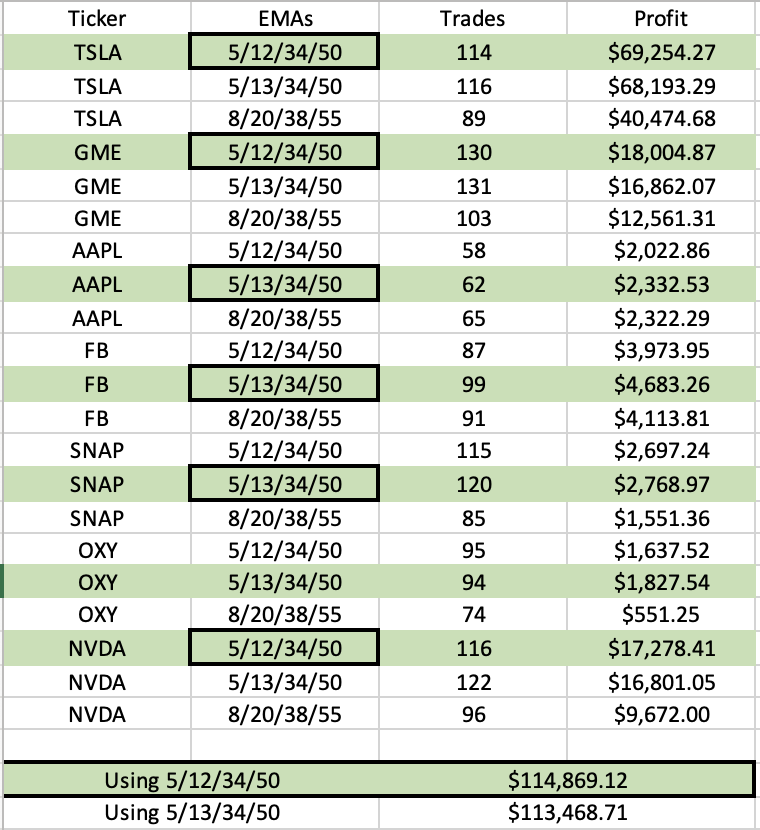
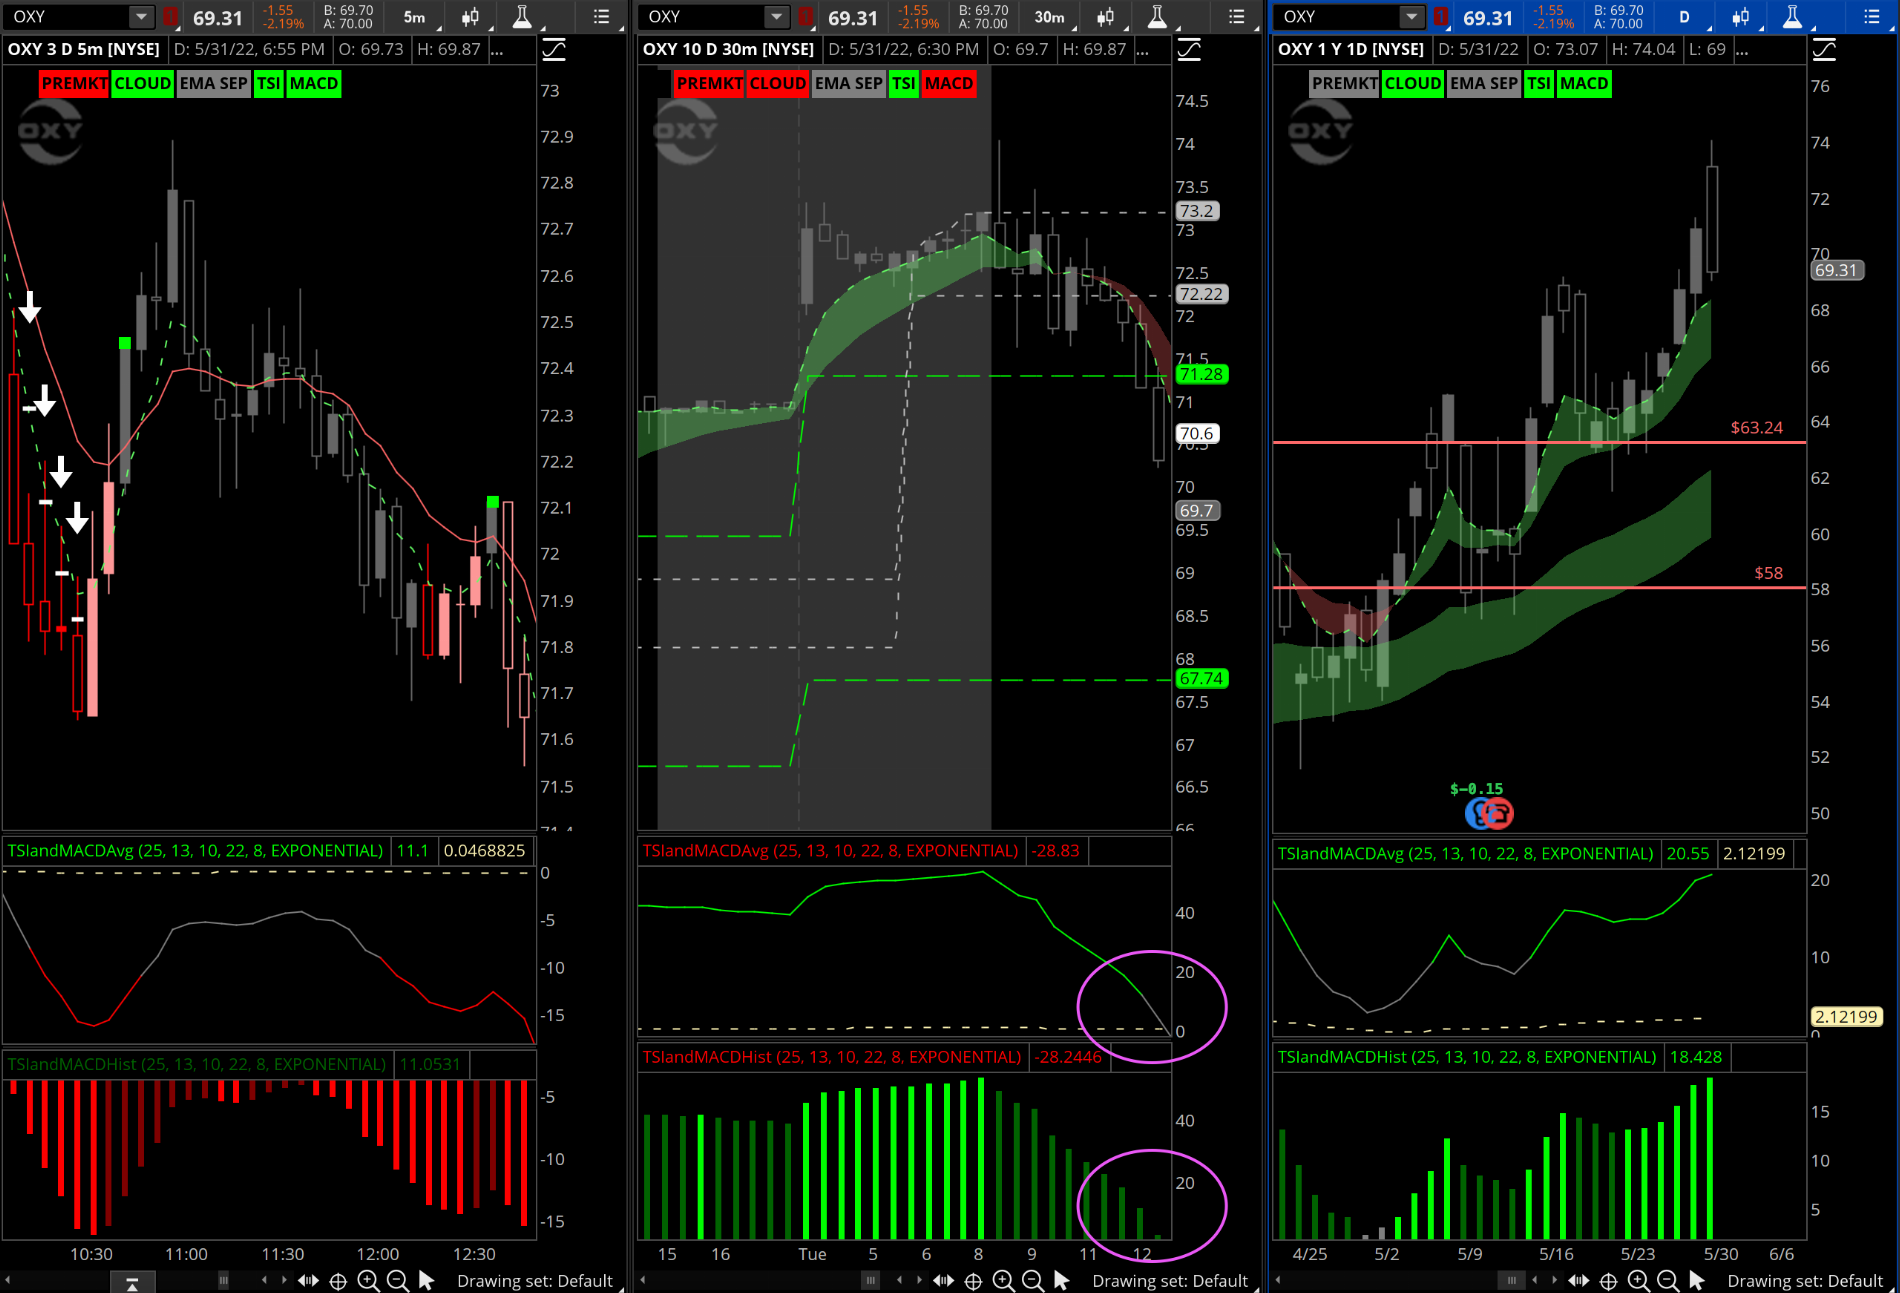
Step 4. Look at the daily charts of the tickers that you like. This is my main screen and what I traded today 5/31/22. My thought was that OXY would go down because the price was so extended from the 5EMA on the daily chart. (I scrolled to the premarket to show what I saw. Obviously can’t do that with the daily candle.) More to come on those histograms on the bottom. TSI and MACD Line - http://tos.mx/91sbV6M and TSI and MACD Histogram - http://tos.mx/5fBU0TW
Step 5. Wait for your bias to play out or admit that you’re wrong and look for another opportunity.
Step 6. Review the Chart Below for what I saw around 0910 CST. My direction is correct but I don’t quite like that the 30 minute is not there yet. Lets wait a bit… In the mean time lets get a price target. $68 Put looks good because that is where the 5EMA is at. Be patient.
Step 7. 30 Minute Histogram is nearing 0 and still declining. I’m about ready to enter but I have to wait on the white arrow to appear and buy as close to the 5EMA as possible.
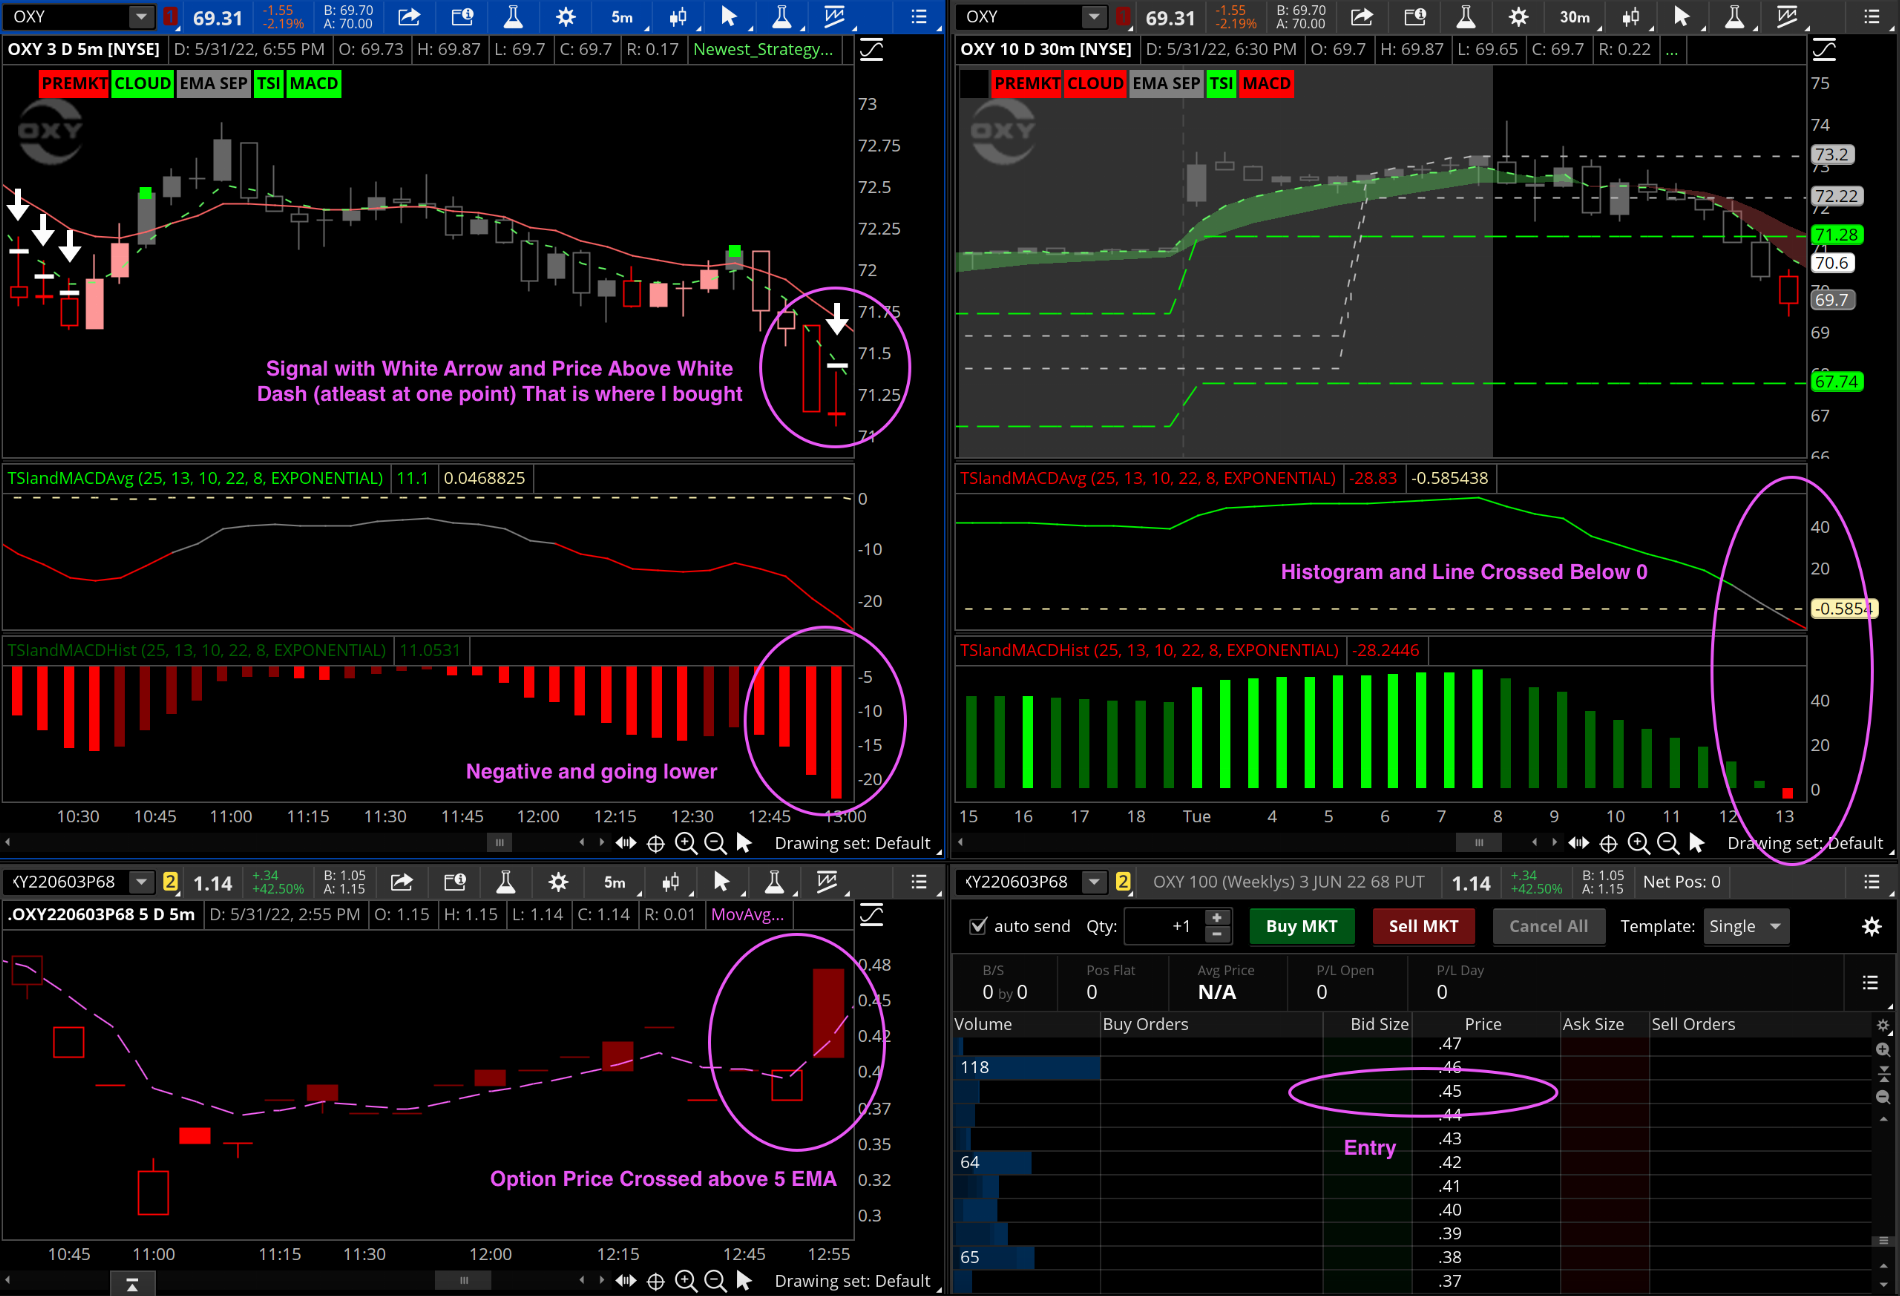
Step 8. Now I switch to my flex grid where I have the 5 minute, 30 minute, 5 minute option that I want to buy, and active trader up. That way I am ready to pounce when the signal hits.
Step 9. Buy. Don’t hesitate. You did the work, now follow through! I entered at $0.45 per contract.
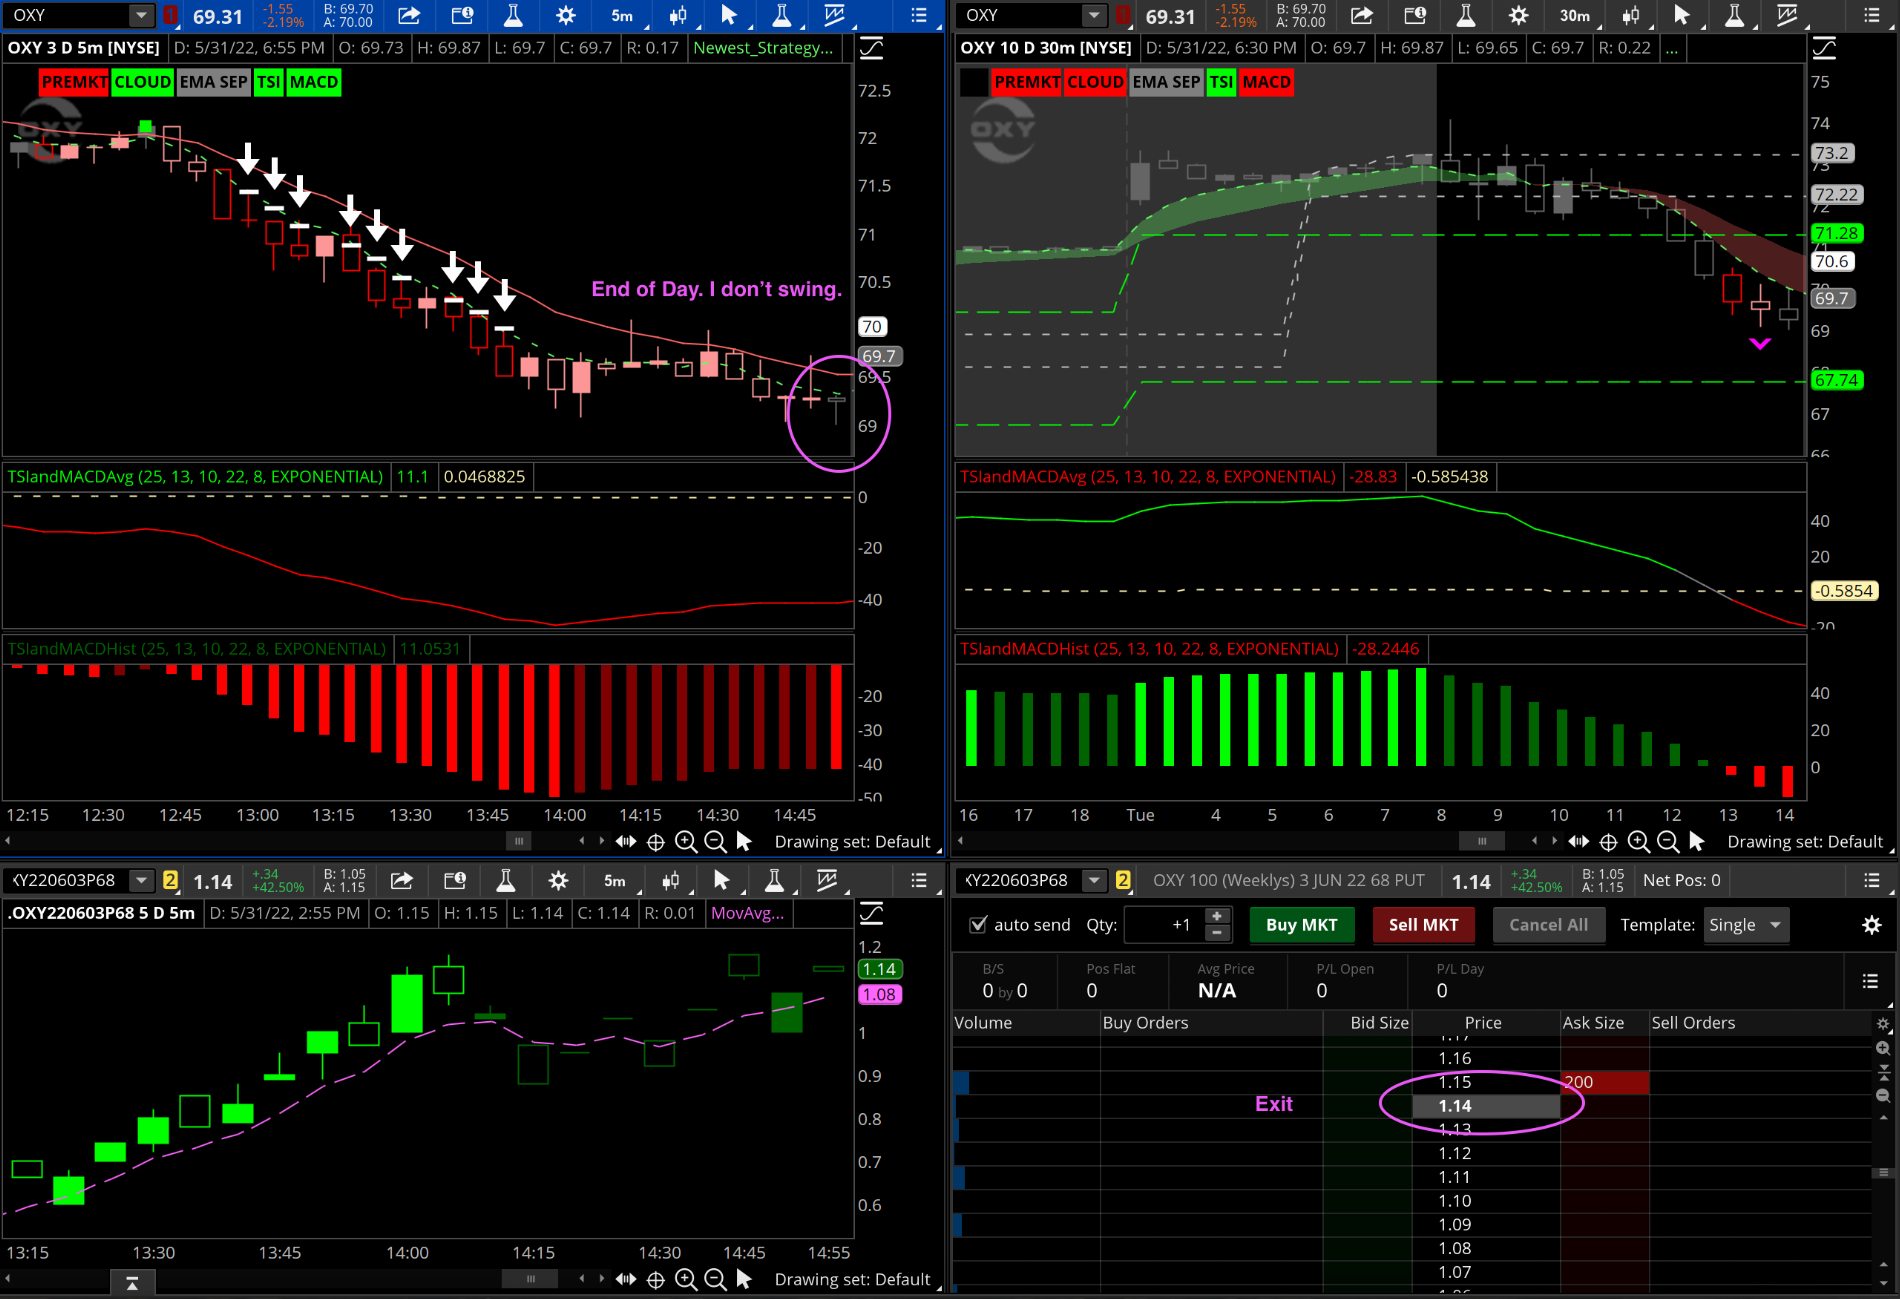
Step 10. Wait for your Exit. You could have exited on the pink boolean candle on the 30 minute chart. I did not. Profits would have been about the same.
Step 11. Take your 150% profit and enjoy your d
Current Version 10.4 - 05/31/2022
Strategy Link: http://tos.mx/P3mxTl4 (Click Setup, Open Shared Item, Paste the Link)
Alternatively, to use the strategy code below (not the link above) click on the charts tab, studies button, edit studies, strategies tab, create, copy and paste the first code in and change the name at the top to your liking, click ok. Make sure to follow the rules on the first post regarding time frame, extended hours etc.
Watchlist Indicator: http://tos.mx/KDtke7m (Click Setup, Open Shared Item, Paste the Link)
For the watchlist custom indicator (again, the code is below not the link above) click the gear icon on your watchlist, customize, type in “custom”, click the small scroll looking icon to the left of an unused custom study, paste the second code in and change the name to your liking (something short), change the “D” to “5m” and check extended hours, click ok.
This is just the preview. More detailed instructions below.
I WILL ADD ALL UPDATES HERE! This strategy is changing and I don’t want to confuse anyone with comments from previous versions in the post below!!!
This is months of trial and error with different strategies and indicators. This is what I have found that works best as of today. I am continually updating this strategy to refine it and/or find better entries and exits. All updates will be posted here on Post #1.
This strategy USES two EMAs (5EMA, 12EMA), MACD, TSI, and Pre-Market High/Low. The EMAs are arranged in a cloud (5EMA / 12EMA). This strategy also INCLUDES but does not USE the 34EMA, 50EMA, and Yesterdays High/Low. These can be turned on and off to your liking.
The triggers I am using are:
Buy Signal only between 8:35 A.M. CST until 2:00 P.M. CST (This can be changed to fit your needs)
EMAs Bullish (5EMA>12EMA) or EMAs Bearish (5EMA<12EMA)
MACD Trending Up or MACD Trending Down
TSI >10 and trending up or TSI <-10 and trending down
Low > the Pre-Market High or High < the Pre-Market Low
Again, subject to change.
Of note, I use this for options so the wording I use in the strategy is geared towards that.
Gray Candles - Criteria Not Met
Red Candle - Put Buy or Sell to Open (Short) (Entry is on the 5EMA or When you get the Buy Bubble)
Light Red Candle - Put Hold or Short Hold
Green Candle - Call Buy or Buy to Open (Long) (Entry is on 5EMA or when you get the Buy Bubble)
Light Green Candle - Call Hold or Long Hold
Candle colors can be changed using the gear icon, scrolling to the very bottom and changing the “globals” settings.
Very basic instructions…
If you FOMO in at the beginning of the day without a buy signal, which you shouldn’t, and you get a Pink Boolean Arrow than GET OUT! The price is too extended from the EMA and you are just asked for a knife candle to kill your profits.
If you were patient and waited on the Buy Signal (white arrow) then get in on that 5EMA (green dashed line) or better. Alternatively, if you missed your entry, then try to get in at least on the white dash or better. This was the entry point from the previous candle.
You should not get a Buy Signal unless the price is already within the defined range of the 5EMA.
If you are confident in your order placing abilities and the spread isn’t too wide you can even set a trailing stop buy order to try to get the best price.
If you get a Pink Boolean Arrow then again, really think about taking profits.
This is a great spot for a trailing stop depending on the spread!
If you get a Grey Candle than get ready to close your trade at the open of the next bar. Don’t get in a hurry though because sometimes the candle will repaint and continue with your trend.
Rinse and Repeat. Don’t Get Fancy! Let It work or move on to a stock that is working!
The difference in my trading waiting on that 5EMA entry was a game changer. In options, if I rushed into a trade that gave me a buy signal before it came back to the 5EMA I might be down 50% within seconds before maybe recovering. However, if I wait on that 5 EMA entry I may never be down or at worst 15%-20% before becoming profitable.
I added labels to the top of the chart for each criteria this strategy is looking for. This will help you “get ready” to buy. If they are all red then get ready to go short or buy puts on that 5EMA. If they are all green than again, get ready to go long or buy calls on that 5EMA.
I THINK the labels should go green/blue from left to right if the stock cooperates. I have noticed that the biggest thing holding up the entry is MACD direction and price at the 5EMA at the same time but then again, that is what makes it mostly* dependable.
Once you are in the trade you can stop looking at the labels. At that point you are just waiting for the grey candle or pink boolean arrow for your exit.
WIth that being said, be careful with options and this study! I chose my stocks based on my 2+ years of trading experience and look at support/resistance to chose the right strike. I am excited about this strategy because every single backtest I ran on every ticker on my watchlist was profitable over the past 10 days when trading 100 shares at a time.
Few Rules:
To be used on 5 minute charts. That is all I have tested it on.
Must have Extended Hours on and I prefer 3 Day / 5 Min zoomed in.
Copy the code and paste it as a STRATEGY not study.
If you so choose, turn on the “Over Ext Clouds”. That is a take profit spot where you would get the pink boolean arrow.
There is no scanner yet but some users are trying to create one that works (one or two are floating around the comments now). I use a flexible grid with 16 charts and load the tickers that I am looking at that particular day. This allows for the fastest response for me personally. Link at the top.
Code:
#JT Newest Strategy Based on EMAs, TSI, Premarket Highs/Lows, and MACD
#VERSION 10.4 - 05/31/2022

#Notes

Declare Upper;

##################################################################
#                                OPTIONS                         #
##################################################################
input ShowTestBubbles = no;
input ShowFlexGridBackgroundColor = no;
input ShowColorDefLabels = yes;
input AlertOn = yes;
input Show200EMA = no;
input ShowFastEMALines = no;
input ShowFastEMACloud = no;
input ShowSlowEMALines = no;
input ShowSlowEMACloud = no;
input ShowPreMarketLines = no;
input ShowPreMarketCloud = no;
input ShowPreMarketLabel = yes;
input ShowPrevDayLines = no;
input ShowPrevDayCloud = no;
input ShowPrevHighLowLabel = no;
input ShowBuySellBubbles = no;
input ShowArrows = yes;
input ShowSquares = yes;
input ShowDashes = yes;
input ShowBooleanArrows = yes;
input ShowOverExtCloud = no;
input ShowTkPftBubble = no;
input ShowOrders = no;
input ShowTkPftOrders = no;

##################################################################
#                                COLORS                          #
##################################################################
DefineGlobalColor("200EMA", createcolor (255, 255, 255));
DefineGlobalColor("CloudUp", createcolor (102, 255, 102));
DefineGlobalColor("CloudDown", createcolor (255, 102, 102));
DefineGlobalColor("OpenLongPosition", createcolor (0, 255, 0));
DefineGlobalColor("OpenShortPosition", createcolor (255, 0, 0));
DefineGlobalColor("HoldLongPosition", createcolor (153, 255, 153));
DefineGlobalColor("HoldShortPosition", createcolor (255, 153, 153));
DefineGlobalColor("SellPosition", createcolor (255, 0, 0));
DefineGlobalColor("TakeProfit", createcolor (255, 0, 255));
DefineGlobalColor("CriteriaNotMet", createcolor (102, 102, 102)); #(255, 255, 0)

##################################################################
#                                 TIMES                          #
##################################################################
#START AND END TIMES
input TimeFrame = {default "5-Min", "1-Min", "10-Min", "15-Min", "30-Min", "1-Hour"};
input PreMarketStart = 0700; #EST
input PreMarketEnd = 0929; #EST
input StartTime = 0930; #EST
input BuySignalDelay = 0;
input EndTime = 1600; #EST
input BuySignalStop = 60; #Minutes Before End of Day
def LastCandleStop; #Last Candle is Sell Candle

        switch (TimeFrame) {
        case "1-min": LastCandleStop = 1;
        case "10-Min": LastCandleStop = 10;
        case "15-Min": LastCandleStop = 15;
        case "30-Min": LastCandleStop = 30;
        case "1-Hour": LastCandleStop = 60;
        default: LastCandleStop = 5;
        }

def TradingDayStart= SecondsFromTime(StartTime);
def BuySignalDelaySeconds = BuySignalDelay * 60;
def SignalStart = TradingDayStart > BuySignalDelaySeconds;
def TradingDayEnd = SecondsTillTime(EndTime);
def EndSignalDelaySeconds = BuySignalStop * 60;
def SignalEnd = TradingDayEnd > EndSignalDelaySeconds;
def TradingDay = SignalStart and SignalEnd; #10:00EST - 1500EST
def LastStopDelaySeconds = LastCandleStop * 60;
def EndDay = TradingDayEnd == LastStopDelaySeconds; #1550EST
def TradingDayExt = TradingDayEnd > LastStopDelaySeconds;

##################################################################
#                              INDICATORS                        #
##################################################################
#200 EMA
plot EMA200 = ExpAverage(HL2, 200);
EMA200.SetDefaultColor(globalcolor("200EMA"));
EMA200.HideBubble();
EMA200.sethiding(!Show200EMA);

#EMAS
input Ema1Length = 5;
input Ema2Length = 12;
input Ema3Length = 34;
input Ema4Length = 50;

plot EMA1 = ExpAverage(close, Ema1Length);
EMA1.SetStyle(Curve.Short_Dash);
EMA1.SetDefaultColor(globalcolor("CloudUp"));
EMA1.HideBubble();
#EMA1.sethiding(!ShowFastEMALines);
plot EMA2 = ExpAverage(close, Ema2Length);
EMA2.SetDefaultColor(globalcolor("CloudDown"));
EMA2.HideBubble();
EMA2.sethiding(!ShowFastEMALines);
AddCloud(if ShowFastEMACloud then EMA1 else double.nan, if ShowFastEMACloud then EMA2 else double.nan, globalcolor("CloudUp"), globalcolor("CloudDown"));
plot EMA3 = ExpAverage(close, Ema3Length);
EMA3.SetDefaultColor(globalcolor("CloudUp"));
EMA3.HideBubble();
EMA3.sethiding(!ShowSlowEMALines);
plot EMA4 = ExpAverage(close, Ema4Length);
EMA4.SetDefaultColor(globalcolor("CloudDown"));
EMA4.HideBubble();
EMA4.sethiding(!ShowSlowEMALines);
AddCloud(if ShowSlowEMACloud then EMA3 else double.nan, if ShowSlowEMACloud then EMA4 else double.nan, globalcolor("CloudUp"), globalcolor("CloudDown"));

    #EMAS BULLISH OR BEARISH
    def EMABullish = EMA1 > EMA2;
    def EMABearish = EMA1 < EMA2;

        #EMA PERCENT SEPERATION
        def EMAPctBull = ((EMA1 / EMA2) * 100) - 100; #Distance Between EMA1 and EMA2
        def EMAPctBullRound = Round(EMAPctBull, 2);
        def EMAPctBear = ((EMA2 / EMA1) * 100) - 100; #Distance Between EMA2 and EMA1
        def EMAPctBearRound = Round(EMAPctBear, 2);

        #FAST EMA PERCENT SEPERATION BUY SIGNAL
        def EMASepThrHld;
        switch (TimeFrame) {
        case "1-min": EMASepThrHld = 0.1;
        case "10-Min": EMASepThrHld = 0.25;
        case "15-Min": EMASepThrHld = 0.25;
        case "30-Min": EMASepThrHld = 0.3;
        case "1-Hour": EMASepThrHld = 0.3;
        default: EMASepThrHld = 0.2;
        }

        def EMAPctBullish = EMAPctBullRound > EMASepThrHld and EMAPctBullRound >= EMAPctBullRound[1];
        def EMAPctBearish = EMAPctBearRound > EMASepThrHld and EMAPctBearRound >= EMAPctBearRound[1];
        #TESTING
        addchartbubble(ShowTestBubbles and EMAPctBullish, High * 1.005, EMAPctBullRound, color.dark_green, yes);
        addchartbubble(ShowTestBubbles and EMAPctBearish, Low * 0.995, EMAPctBearRound, color.dark_red, no);

            #EMA SELL SIGNALS
            def EMACrossDown = EMA1 crosses below EMA2;
            def EMACrossUp = EMA1 crosses above EMA2;

#TSI
input TSILongLength = 25;
input TSIShortLength = 13;
input TSISignalLength = 8;

def TSIDiff = close - close[1];
def DoubleSmoothedAbsDiff = ExpAverage(ExpAverage(AbsValue(TSIDiff), TSILongLength), TSIShortLength);
def TSIRound = Round((100 * (ExpAverage(ExpAverage(TSIDiff, TSILongLength), TSIShortLength)) / DoubleSmoothedAbsDiff), 2);

    #TSI BUY SIGNAL
    def TSIBull = (TSIRound > TSIRound[2]); #(TSIRound > 10)
    def TSIBear = (TSIRound < TSIRound[2]); #(TSIRound < -10)

        #TSI SELL SIGNAL
        def TSICrossDown = TSIRound < (TSIRound[1] * 0.91);
        def TSICrossUp = TSIRound > (TSIRound[1] * 0.91);

#MACD
input MACDFast = 10;
input MACDSlow = 22;
input MACDLength = 8;

def MACDValue = ExpAverage(close, MACDFast) - ExpAverage(close, MACDSlow);
def MACDAverage = ExpAverage(MACDValue, MACDLength);
def MACDDiff = MACDValue - MACDAverage;
def ZeroLine = 0;

    #MACD BUY SIGNAL
    def MACDBull = TSIRound > MACDAverage; #(MACDAverage > MACDAverage[1]) within 3 bars;
    def MACDBear = TSIRound < MACDAverage; #(MACDAverage < MACDAverage[1]) within 3 bars;

#TSI AND MACD SELL SIGNAL
def TSIMACDLongSell = TSIRound crosses below MACDAverage;
def TSIMACDShortSell = TSIRound crosses above MACDAverage;

##################################################################
#                          PREMARKET                             #
##################################################################
#PREMARKET HIGHS AND LOWS
def PreMarketTimeRange = secondsFromTime(PreMarketStart) >= 0 and secondsTillTime(PreMarketEnd) >= 0;
def PreMarket = PreMarketTimeRange and !PremarketTimeRange[1];
def Pre_Market_High = compoundValue(1, if((high > Pre_Market_High[1] and PremarketTimeRange) or PreMarket, high, Pre_Market_High[1]), high);
def Pre_Market_Low = compoundValue(1, if((low < Pre_Market_Low[1] and PremarketTImeRange) or PreMarket, low, Pre_Market_Low[1]), low);

plot PreMarketHigh = Pre_Market_High;
PreMarketHigh.SetStyle(curve.short_dash);
PreMarketHigh.SetDefaultColor(color.light_gray);
PreMarketHigh.Sethiding(!ShowPreMarketLines);
plot PreMarketLow = Pre_Market_Low;
PreMarketLow.SetStyle(curve.short_dash);
PreMarketLow.SetDefaultColor(color.light_gray);
PreMarketLow.Sethiding(!ShowPreMarketLines);
AddCloud(if ShowPreMarketCloud then PreMarketHigh else double.nan, if ShowPreMarketCloud then PreMarketLow else double.nan, color.light_gray, color.light_gray);

AddLabel(if ShowPreMarketLabel then yes else no, "   ", color.black);
AddLabel(if ShowPreMarketLabel then yes else no, " PM High - $" + PreMarketHigh + " ", color.gray);
AddLabel(if ShowPreMArketLabel then yes else no, " PM Low - $" + PreMarketLow + " ", color.gray);

    #PREMARKET HIGH/LOW BUY SIGNAL
    def PreMarketBull = close > Pre_Market_High;
    def PreMarketBear = close < Pre_Market_Low;

        #PREMARKET HIGH/LOW SELL SIGNAL
        def PreMarketBullSell = PreMarketBull[1] and low < Pre_Market_High;
        def PreMarketBearSell = PreMarketBear[1] and high > Pre_Market_Low;

##################################################################
#                      YESTERDAY HIGH/LOW                        #
##################################################################
plot PrevHigh = high(period = "day")[1];
PrevHigh.SetStyle(curve._dash);
PrevHigh.SetDefaultColor(Color.GREEN);
PrevHigh.Sethiding(!ShowPrevDayLines);
plot PrevLow = low(period = "day")[1];
PrevLow.SetStyle(curve._dash);
PrevLow.SetDefaultColor(Color.GREEN);
PrevLow.Sethiding(!ShowPrevDayLines);
AddCloud(if ShowPrevDayCloud then PrevHigh else double.nan, if ShowPrevDayCloud then PrevLow else double.nan, color.light_gray, color.light_gray);

AddLabel(if ShowPrevHighLowLabel then 1 else 0, "   ", color.black);
AddLabel(if ShowPrevHighLowLabel then 1 else 0, "Prev High " + "$ " + PrevHigh + " ", color.gray);
AddLabel(if ShowPrevHighLowLabel then 1 else 0, "Prev Low " + "$ " + PrevLow + " ", color.gray);

##################################################################
#                               SIGNALS                          #
##################################################################
#INDICATOR BUY SIGNALS
def LongBuyInd = TradingDay and EMABullish and EMAPctBullish and MACDBull and TSIBull and PreMarketBull;
def ShortBuyInd = TradingDay and EMABearish and EMAPctBearish and MACDBear and TSIBear and PreMarketBear;

plot LongEntryLine = if (LongBuyInd[1] or LongBuyInd[2]) and ShowDashes and LongBuyInd then EMA1[1] * 1.0025 else double.nan;
LongEntryLine.SetPaintingStrategy(PaintingStrategy.Dashes);
LongEntryLine.SetDefaultColor(color.white);
LongEntryLine.SetLineWeight(3);
plot ShortEntryLine = if (ShortBuyInd[1] or ShortBuyInd[2]) and ShowDashes and ShortBuyInd then EMA1[1] * 0.9975 else double.nan;
ShortEntryLine.SetPaintingStrategy(PaintingStrategy.Dashes);
ShortEntryLine.SetDefaultColor(color.white);
ShortEntryLine.SetLineWeight(3);

#INDICATOR ENTRY SIGNALS
def LongEntryInd = (LongBuyInd[1] or LongBuyInd[2]) and LongBuyInd and low <= (EMA1 * 1.0025);
def ShortEntryInd = (ShortBuyInd[1] or ShortBuyInd[2]) and ShortBuyInd and high >= (EMA1 * 0.9975);

#INDICATOR HOLD SIGNALS
def LongHoldInd = TradingDayExt and PreMarketBull and (LongBuyInd[1] or LongHoldInd[1]);
def ShortHoldInd = TradingDayExt and PreMarketBear and (ShortBuyInd[1] or ShortHoldInd[1]);

##################################################################
#         ADDED FAST EMA PCT HERE BASED OFF BUY SIGNAL           #
##################################################################
            def EMAPctAtLongBuy = if LongEntryInd then EMAPctBullRound else EMAPctAtLongBuy[1];
            def EMAPctAtShortBuy = if ShortEntryInd then EMAPctBearRound else EMAPctAtShortBuy[1];

                #FAST EMA CLOUD SELL TRIGGER BASED OFF BUY INDICATOR
                input EMAPctDecFromBuy = 0.6;
                def LongEMAPctSell = EMAPctBullRound < (EMAPctAtLongBuy * EMAPctDecFromBuy);
                def ShortEMAPctSell = EMAPctBearRound < (EMAPctAtShortBuy * EMAPctDecFromBuy);

##################################################################
#                         SIGNALS CONT.                          #
##################################################################
    #SELL SIGNALS
    def LongPriceActSell = low < low[4];
    def ShortPriceActSell = high > high[4];
    def LongSellInd = TradingDayExt and (close < open) and close < EMA1 and LongPriceActSell and close < EMA2 and (EMACrossDown or TSICrossDown or LongEMAPctSell or TSIMACDLongSell);
    def ShortSellInd = TradingDayExt and (close > open) and close > EMA1 and ShortPriceActSell and close > EMA2 and (EMACrossUp or TSICrossUp or ShortEMAPctSell or TSIMACDShortSell);
        #TESTING
        addchartbubble(ShowTestBubbles and TSICrossDown, High * 1.005, "T-Dn", color.dark_green, yes);
        addchartbubble(ShowTestBubbles and TSICrossUp, Low * 0.995, "T-Up", color.dark_red, no);
        addchartbubble(ShowTestBubbles and EMACrossDown, High * 1.005, "E-X-Dn", color.dark_green, yes);
        addchartbubble(ShowTestBubbles and EMACrossUp, Low * 0.995, "E-X-Up", color.dark_red, no);
        addchartbubble(ShowTestBubbles and LongEMAPctSell, High * 1.005, "E-Pct-Dn", color.dark_green, yes);
        addchartbubble(ShowTestBubbles and SHortEMAPctSell, Low * 0.995, "E-Pct-Up", color.dark_red, no);

    #HOLD SIGNALS
    def LongHoldInd2 = LongHoldInd and !LongSellInd;
    def ShortHoldInd2 = ShortHoldInd and !ShortSellInd;

##################################################################
#                                 BARS                           #
##################################################################
AssignPriceColor(if LongBuyInd then GlobalColor("OpenLongPosition") else if ShortBuyInd then GlobalColor("OpenShortPosition") else if LongHoldInd2 then GlobalColor("HoldLongPosition") else if ShortHoldInd2 then GlobalColor("HoldShortPosition") else GlobalColor("CriteriaNotMet"));

##################################################################
# EMA TAKE PROFIT CLOUD (IDENTIFY IF PRICE IS EXTENDED FROM EMAS)#
##################################################################
            def OvrExtUp1 = if ShowOverExtCloud and SignalStart and TradingDayExt and (LongEntryInd or LongHoldInd2) then EMA1 * 1.01 else Double.NaN;
            def OvrExtUp2 = if ShowOverExtCloud and SignalStart and TradingDayExt and (LongEntryInd or LongHoldInd2) then EMA1 * 1.02 else Double.NaN;
            AddCloud(OvrExtUp1, OvrExtUp2, color.light_green, color.light_green);
            def OvrExtDn1 = if ShowOverExtCloud and SignalStart and TradingDayExt and (ShortEntryInd or ShortHoldInd2) then EMA1 * 0.99 else Double.NaN;
            def OvrExtDn2 = if ShowOverExtCloud and SignalStart and TradingDayExt and (ShortEntryInd or ShortHoldInd2) then EMA1 * 0.98 else Double.NaN;
            AddCloud(OvrExtDn1, OvrExtDn2, color.light_green, color.light_green);

##################################################################
#                                LABELS                          #
##################################################################
#LABELS
AddLabel(yes, "     ", color.black);
AddLabel(yes, "PREMKT", if PreMarketBull then GlobalColor("OpenLongPosition") else if PreMarketBear then GlobalColor("OpenShortPosition") else color.gray);
AddLabel(yes, "CLOUD", if EMABullish then GlobalColor("OpenLongPosition") else if EMABearish then GlobalColor("OpenShortPosition") else color.gray);
AddLabel(yes, "EMA SEP", if EMAPctBullish then GlobalColor("OpenLongPosition") else if EMAPctBearish then GlobalColor("OpenShortPosition") else color.gray);
AddLabel(yes, "TSI", if TSIBull then GlobalColor("OpenLongPosition") else if TSIBear then GlobalColor("OpenShortPosition") else color.gray);
AddLabel(yes, "MACD", if MACDBull then GlobalColor("OpenLongPosition") else if MACDBear then GlobalColor("OpenShortPosition") else color.gray);

##################################################################
#               CHART BUBBLES/POINTS FOR BUY/SELL                #
##################################################################
#BUY
def LongBuyBub = LongEntryInd;
addchartbubble(ShowBuySellBubbles and LongBuyBub, High * 1.005, "Long", color.green, yes);
def ShortBuyBub = ShortEntryInd;
addchartbubble(ShowBuySellBubbles and ShortBuyBub, Low * 0.995, "Short", color.red, no);

plot LongBuyPoint = if ShowArrows and LongBuyBub then EMA1[1] else double.nan;
LongBuyPoint.SetDefaultColor(color.white);
LongBuyPoint.SetPaintingStrategy(PaintingStrategy.Arrow_Up);
LongBuyPoint.SetLineWeight(5);
LongBuyPoint.HideBubble();
plot ShortBuyPoint = if ShowArrows and ShortBuyBub then EMA1[1] else double.nan;
ShortBuyPoint.SetDefaultColor(color.white);
ShortBuyPoint.SetPaintingStrategy(PaintingStrategy.Arrow_Down);
ShortBuyPoint.SetLineWeight(5);
ShortBuyPoint.HideBubble();

#SELL
def LongSellBub = (LongEntryInd[1] or LongHoldInd2[1]) and (LongEntryInd[2] or LongHoldInd2[2]) and LongSellInd;
addchartbubble(ShowBuySellBubbles and LongSellBub, High * 1.005, "Sell", color.red, yes);
def ShortSellBub = (ShortEntryInd[1] or ShortHoldINd2[1]) and (ShortEntryInd[2] or ShortHoldINd2[2]) and ShortSellInd;
addchartbubble(ShowBuySellBubbles and ShortSellBub, Low * 0.995, "Sell", color.green, no);

plot LongSellPoint = if ShowSquares and LongSellBub then Close else double.nan;
LongSellPoint.SetDefaultColor(color.red);
LongSellPoint.SetPaintingStrategy(PaintingStrategy.Squares);
LongSellPoint.SetLineWeight(5);
LongSellPoint.HideBubble();
plot ShortSellPoint = if ShowSquares and ShortSellBub then Close else double.nan;
ShortSellPoint.SetDefaultColor(color.green);
ShortSellPoint.SetPaintingStrategy(PaintingStrategy.Squares);
ShortSellPoint.SetLineWeight(5);
ShortSellPoint.HideBubble();

#TAKE PROFIT
def LongTkPftBub = TradingDayExt and (LongEntryInd or LongHoldInd2) and high > EMA1 * 1.01;
addchartbubble(ShowTkPftBubble and LongTkPftBub, high * 1.001, "Tk Pft", GlobalColor("TakeProfit"), yes);
def ShortTkPftBub = TradingDayExt and (ShortEntryInd or ShortHoldInd2) and low < EMA1 * 0.99;
addchartbubble(ShowTkPftBubble and ShortTkPftBub, low * 0.999, "Tk Pft", GlobalColor("TakeProfit"), no);

plot LongTkPftPoint = if ShowBooleanArrows and LongTkPftBub then High else double.nan;
LongTkPftPoint.SetDefaultColor(GlobalColor("TakeProfit"));
LongTkPftPoint.SetPaintingStrategy(PaintingStrategy.Boolean_Wedge_Up);
LongTkPftPoint.SetLineWeight(5);
LongTkPftPoint.HideBubble();
plot ShortTkPftPoint = if ShowBooleanArrows and ShortTkPftBub then Low else double.nan;
ShortTkPftPoint.SetDefaultColor(GlobalColor("TakeProfit"));
ShortTkPftPoint.SetPaintingStrategy(PaintingStrategy.Boolean_Wedge_Down);
ShortTkPftPoint.SetLineWeight(5);
ShortTkPftPoint.HideBubble();

##################################################################
#                             STOP LOSS                          #
##################################################################
def longstop = if (open < close) then open else close;
def shortstop = if (open > close) then open else close;
addlabel(if (LongBuyInd or LongHoldInd2) then yes else no, "STOP $ " + longstop[4] + " ", color.white);
addlabel(if (ShortBuyInd or ShortHoldInd2) then yes else no, "STOP $ " + shortstop[4] + " ", color.white);

##################################################################
#                                ORDERS                          #
##################################################################
def orderQuantity = Round(10000 / open, 0);

#BUY ORDERS
AddOrder(OrderType.BUY_TO_OPEN, ShowOrders and LongEntryInd, EMA1 * 1.0025, 100, Color.GREEN, Color.LIGHT_GREEN);
AddOrder(OrderType.SELL_TO_OPEN, ShowOrders and ShortEntryInd, EMA1 * 0.9975, 100, Color.GREEN, Color.LIGHT_GREEN);

#SELL ORDERS
AddOrder(OrderType.SELL_TO_CLOSE, ShowOrders and ShowTkPftOrders and LongTkPftBub, high * 0.999, 100, Color.RED, Color.LIGHT_RED);
AddOrder(OrderType.SELL_TO_CLOSE, ShowOrders and (LongSellInd or EndDay[-1]), open[-1], 100, Color.RED, Color.LIGHT_RED);
AddOrder(OrderType.BUY_TO_CLOSE, ShowOrders and ShowTkPftOrders and ShortTkPftBub, low * 1.001, 100, Color.RED, Color.LIGHT_RED);
AddOrder(OrderType.BUY_TO_CLOSE, ShowOrders and (ShortSellInd or EndDay[-1]), open[-1], 100, Color.RED, Color.LIGHT_RED);
##################################################################
#                                ALERTS                          #
##################################################################
Alert(AlertOn and (LongSellBub or ShortSellBub or LongTkPftBub or ShortTkPftBub), "SELL" + GetSymbol(), Alert.BAR, Sound.Bell);
Alert(AlertOn and (LongBuyInd or ShortBuyInd), "BUY" + GetSymbol(), Alert.BAR, Sound.Chimes);

##################################################################
#                       CANDLE COLOR LABEL                       #
##################################################################
AddLabel(if ShowColorDefLabels == 1 then yes else no, "     ", color.black);
AddLabel(if ShowColorDefLabels == 1 then yes else no, "Long Ind", GlobalColor("OpenLongPosition"));
AddLabel(if ShowColorDefLabels == 1 then yes else no, "Long Hld", GlobalColor("HoldLongPosition"));
AddLabel(if ShowColorDefLabels == 1 then yes else no, "Short Ind", GlobalColor("OpenShortPosition"));
AddLabel(if ShowColorDefLabels == 1 then yes else no, "Short Hld", GlobalColor("HoldShortPosition"));
AddLabel(if ShowColorDefLabels == 1 then yes else no, "No Criteria", GlobalColor("CriteriaNotMet"));

##################################################################
#                BACKGROUND COLOR FOR FLEX GRID                  #
##################################################################
AssignBackgroundColor(if ShowFlexGridBackgroundColor and LongBuyInd then GlobalColor("OpenLongPosition") else if ShowFlexGridBackgroundColor and ShortBuyInd then GlobalColor("OpenShortPosition") else if ShowFlexGridBackgroundColor and (LongTkPftBub or ShortTkPftBub) then GlobalColor("TakeProfit") else color.current);
And last but not least, my watchlist indicator. I only use this to visually tell me when to take a closer look at a stock. I have whittled down my watchlist to ones that I know move and have plenty of options flow. Make sure your watchlist study is set to 5 Min and Extended Hours are turned On.
The numbers mean nothing. It is just my way of sorting. You can change the labels to whatever you want in the bottom of the code under “Label”
You will only get a signal on the chart and the watchlist between 8:35 A.M. CST and 2:55 P.M. CST.
Code:
#JT Newest Strategy Based on EMAs, TSI, Premarket Highs/Lows, and MACD
#VERSION 10.3 - 05/26/2022

#Notes

##################################################################
#                                 TIMES                          #
##################################################################
#START AND END TIMES
def PreMarketStart = 0700; #EST
def PreMarketEnd = 0929; #EST
def StartTime = 0930; #EST
def BuySignalDelay = 0;
def EndTime = 1600; #EST
def BuySignalStop = 60; #Minutes Before End of Day
def LastCandleStop = 5; #Last Candle is Sell Candle


def TradingDayStart= SecondsFromTime(StartTime);
def BuySignalDelaySeconds = BuySignalDelay * 60;
def SignalStart = TradingDayStart > BuySignalDelaySeconds;
def TradingDayEnd = SecondsTillTime(EndTime);
def EndSignalDelaySeconds = BuySignalStop * 60;
def SignalEnd = TradingDayEnd > EndSignalDelaySeconds;
def TradingDay = SignalStart and SignalEnd; #10:00EST - 1500EST
def LastStopDelaySeconds = LastCandleStop * 60;
def EndDay = TradingDayEnd == LastStopDelaySeconds; #1550EST
def TradingDayExt = TradingDayEnd > LastStopDelaySeconds;

##################################################################
#                              INDICATORS                        #
##################################################################
#200 EMA
def EMA200 = ExpAverage(HL2, 200);

#EMAS
def Ema1Length = 5;
def Ema2Length = 12;

def EMA1 = ExpAverage(close, Ema1Length);
def EMA2 = ExpAverage(close, Ema2Length);

    #EMAS BULLISH OR BEARISH
    def EMABullish = EMA1 > EMA2;
    def EMABearish = EMA1 < EMA2;

        #EMA PERCENT SEPERATION
        def EMAPctBull = ((EMA1 / EMA2) * 100) - 100; #Distance Between EMA1 and EMA2
        def EMAPctBullRound = Round(EMAPctBull, 2);
        def EMAPctBear = ((EMA2 / EMA1) * 100) - 100; #Distance Between EMA2 and EMA1
        def EMAPctBearRound = Round(EMAPctBear, 2);

        def EMAPctBullish = EMAPctBullRound > 0.2 and EMAPctBullRound >= EMAPctBullRound[1];
        def EMAPctBearish = EMAPctBearRound > 0.2 and EMAPctBearRound >= EMAPctBearRound[1];

            #EMA SELL SIGNALS
            def EMACrossDown = EMA1 crosses below EMA2;
            def EMACrossUp = EMA1 crosses above EMA2;

#TSI
def TSILongLength = 25;
def TSIShortLength = 13;
def TSISignalLength = 8;

def TSIDiff = close - close[1];
def DoubleSmoothedAbsDiff = ExpAverage(ExpAverage(AbsValue(TSIDiff), TSILongLength), TSIShortLength);
def TSIRound = Round((100 * (ExpAverage(ExpAverage(TSIDiff, TSILongLength), TSIShortLength)) / DoubleSmoothedAbsDiff), 2);

    #TSI BUY SIGNAL
    def TSIBull = (TSIRound > TSIRound[2]); #(TSIRound > 10)
    def TSIBear = (TSIRound < TSIRound[2]); #(TSIRound < -10)

        #TSI SELL SIGNAL
        def TSICrossDown = TSIRound < (TSIRound[1] * 0.91);
        def TSICrossUp = TSIRound > (TSIRound[1] * 0.91);

#MACD
def MACDFast = 10;
def MACDSlow = 22;
def MACDLength = 8;

def MACDValue = ExpAverage(close, MACDFast) - ExpAverage(close, MACDSlow);
def MACDAverage = ExpAverage(MACDValue, MACDLength);
def MACDDiff = MACDValue - MACDAverage;
def ZeroLine = 0;

    #MACD BUY SIGNAL
    def MACDBull = TSIRound > MACDAverage; #(MACDAverage > MACDAverage[1]) within 3 bars;
    def MACDBear = TSIRound < MACDAverage; #(MACDAverage < MACDAverage[1]) within 3 bars;

#TSI AND MACD SELL SIGNAL
def TSIMACDLongSell = TSIRound crosses below MACDAverage;
def TSIMACDShortSell = TSIRound crosses above MACDAverage;

##################################################################
#                          PREMARKET                             #
##################################################################
#PREMARKET HIGHS AND LOWS
def PreMarketTimeRange = secondsFromTime(PreMarketStart) >= 0 and secondsTillTime(PreMarketEnd) >= 0;
def PreMarket = PreMarketTimeRange and !PremarketTimeRange[1];
def Pre_Market_High = compoundValue(1, if((high > Pre_Market_High[1] and PremarketTimeRange) or PreMarket, high, Pre_Market_High[1]), high);
def Pre_Market_Low = compoundValue(1, if((low < Pre_Market_Low[1] and PremarketTImeRange) or PreMarket, low, Pre_Market_Low[1]), low);

def PreMarketHigh = Pre_Market_High;
def PreMarketLow = Pre_Market_Low;

    #PREMARKET HIGH/LOW BUY SIGNAL
    def PreMarketBull = close > Pre_Market_High;
    def PreMarketBear = close < Pre_Market_Low;

        #PREMARKET HIGH/LOW SELL SIGNAL
        def PreMarketBullSell = PreMarketBull[1] and low < Pre_Market_High;
        def PreMarketBearSell = PreMarketBear[1] and high > Pre_Market_Low;

##################################################################
#                               SIGNALS                          #
##################################################################
#INDICATOR BUY SIGNALS
def LongBuyInd = TradingDay and EMABullish and EMAPctBullish and MACDBull and TSIBull and PreMarketBull;
def ShortBuyInd = TradingDay and EMABearish and EMAPctBearish and MACDBear and TSIBear and PreMarketBear;

#INDICATOR ENTRY SIGNALS
def LongEntryInd = (LongBuyInd[1] or LongBuyInd[2]) and LongBuyInd and low <= (EMA1 * 1.0025);
def ShortEntryInd = (ShortBuyInd[1] or ShortBuyInd[2]) and ShortBuyInd and high >= (EMA1 * 0.9975);

#INDICATOR HOLD SIGNALS
def LongHoldInd = TradingDayExt and PreMarketBull and (LongBuyInd[1] or LongHoldInd[1]);
def ShortHoldInd = TradingDayExt and PreMarketBear and (ShortBuyInd[1] or ShortHoldInd[1]);

##################################################################
#         ADDED FAST EMA PCT HERE BASED OFF BUY SIGNAL           #
##################################################################
            def EMAPctAtLongBuy = if LongEntryInd then EMAPctBullRound else EMAPctAtLongBuy[1];
            def EMAPctAtShortBuy = if ShortEntryInd then EMAPctBearRound else EMAPctAtShortBuy[1];

                #FAST EMA CLOUD SELL TRIGGER BASED OFF BUY INDICATOR
                def LongEMAPctSell = EMAPctBullRound < (EMAPctAtLongBuy * 0.6);
                def ShortEMAPctSell = EMAPctBearRound < (EMAPctAtShortBuy * 0.6);

##################################################################
#                         SIGNALS CONT.                          #
##################################################################
    #SELL SIGNALS
    def LongPriceActSell = low < low[4];
    def ShortPriceActSell = high > high[4];
    def LongSellInd = TradingDayExt and (close < open) and (EMACrossDown or TSICrossDown or LongEMAPctSell or LongPriceActSell or TSIMACDLongSell);
    def ShortSellInd = TradingDayExt and (close > open) and (EMACrossUp or TSICrossUp or ShortEMAPctSell or ShortPriceActSell or TSIMACDShortSell);

    #HOLD SIGNALS
    def LongHoldInd2 = LongHoldInd and !LongSellInd;
    def ShortHoldInd2 = ShortHoldInd and !ShortSellInd;

##################################################################
#               CHART BUBBLES/POINTS FOR BUY/SELL                #
##################################################################
#TAKE PROFIT
def LongTkPftBub = TradingDayExt and (LongEntryInd or LongHoldInd2) and high > EMA1 * 1.01;
def ShortTkPftBub = TradingDayExt and (ShortEntryInd or ShortHoldInd2) and low < EMA1 * 0.99;

##################################################################
#                        WATCHLIST INDICATOR                     #
##################################################################

#LABEL
AddLabel(yes, if LongBuyInd then "1. LONG" else if LongHoldInd2 then "4. LONG HOLD" else if ShortBuyInd then "2. SHORT" else if ShortHoldInd2 then "5. SHORT HOLD" else if LongTkPftBub or ShortTkPftBub then "3. TAKE PROFIT" else "6. NO GO");

#BACKGROUND
AssignBackgroundColor(if LongBuyInd then createcolor (0, 255, 0) else if LongHoldInd2 then createcolor (153, 255, 153) else if ShortBuyInd then createcolor (255, 0, 0) else if ShortHoldInd2 then createcolor (255, 153, 153) else if LongTkPftBub or ShortTkPftBub then createcolor (255, 0, 255) else createcolor (102, 102, 102));
What can go wrong….?
See the chart below. You will notice green candles which means all criteria to buy are met EXCEPT the price being within the defined range of the 5EMA. Because the price is extended, you didn’t get a white arrow. If you FOMO’d in, get out on the pink boolean arrow. You will notice after 5 minutes the price sharply reverses down and below the 5EMA. The price eventually normalizes and starts a gradual uptrend. You would do your best to enter on the candle with the white arrow, as close as possible to the 5EMA and definitely below the white dash. You would then wait for a grey candle to completely close and then exit at the open of the following candle.
I didn’t just pull that over extended cloud out of nowhere. That was me looking at multiple charts and coming up with the best number (probably has something to do with other algos).
To the right is what it’s supposed to look like.
Some light backtesting here. This is over 90 days and BEFORE I backtested with the pink boolean arrows.
If you happen to have something of value to add please don’t hesitate to post that here. This is however about 6 months of trial and error in the making.
###################################################################################
This is how I trade personally. Do whatever you want with this information.
Step 1. Before pre-market opens if I am awake. I look at the futures to get an idea of the direction of the market and VIX futures. So I am following the rules of the site. Here are the links to the two watchlist columns below. Not pertinent at this point. MT5 - http://tos.mx/4hzwiEn MT30 - http://tos.mx/45R1EOH
Step 2. Look at my watchlist throughout the premarket to get an idea on what is running or what sectors may be in play. This comes with experience. I am strictly looking at percent gain or percent loss.
Step 3. Pick a few stocks that I think I want to trade. That may be based on news, pre-market action, recent earnings, some Elon Must Twitter post etc. I want something that is going to move! I would highly prefer that it move with the sector and with the futures and/or index it’s trading in.
Step 4. Look at the daily charts of the tickers that you like. This is my main screen and what I traded today 5/31/22. My thought was that OXY would go down because the price was so extended from the 5EMA on the daily chart. (I scrolled to the premarket to show what I saw. Obviously can’t do that with the daily candle.) More to come on those histograms on the bottom. TSI and MACD Line - http://tos.mx/91sbV6M and TSI and MACD Histogram - http://tos.mx/5fBU0TW
Step 5. Wait for your bias to play out or admit that you’re wrong and look for another opportunity.
Step 6. Review the Chart Below for what I saw around 0910 CST. My direction is correct but I don’t quite like that the 30 minute is not there yet. Lets wait a bit… In the mean time lets get a price target. $68 Put looks good because that is where the 5EMA is at. Be patient.
Step 7. 30 Minute Histogram is nearing 0 and still declining. I’m about ready to enter but I have to wait on the white arrow to appear and buy as close to the 5EMA as possible.
Step 8. Now I switch to my flex grid where I have the 5 minute, 30 minute, 5 minute option that I want to buy, and active trader up. That way I am ready to pounce when the signal hits.
Step 9. Buy. Don’t hesitate. You did the work, now follow through! I entered at $0.45 per contract.
Step 10. Wait for your Exit. You could have exited on the pink boolean candle on the 30 minute chart. I did not. Profits would have been about the same.
Step 11. Take your 150% profit and enjoy your day!
@a1cturner, I was just running through some testing of this strategy and came across this issue. i know that all trade do not work out but I was wondering if there is something I am overlooking that would have prompted me not to enter this trade around 9:50.
@a1cturner, I was just running through some testing of this strategy and came across this issue. i know that all trade do not work out but I was wondering if there is something I am overlooking that would have prompted me not to enter this trade around 9:50.
From my personal experience using it on my charts when everything seems to line up with the strategy I still don’t take the trade unless I’m seeing some type of rejection from S@R or a key level is in play because sometimes even with the strategy being a good tool to use it can and will throw a weird signal that you absolutely need to not take just my observation.
When I see those arrows the first thing I ask myself is why are the arrows appearing here if I can’t answer the question based off of what my chart is telling me i don’t take the trade
@a1cturner, I was just running through some testing of this strategy and came across this issue. i know that all trade do not work out but I was wondering if there is something I am overlooking that would have prompted me not to enter this trade around 9:50.
In the setting turn show Prev. day lines to yes. price bounced close to prev. day low. Look at the same trade today. Once it broke down through the previous day low it came back up and tested it then it dropped.
@a1cturner, I was just running through some testing of this strategy and came across this issue. i know that all trade do not work out but I was wondering if there is something I am overlooking that would have prompted me not to enter this trade around 9:50.
@METAL I went and stuck it on a chart to see the clearer picture of the signal that was given and on my chart at this time it couldn’t break and close below the open from the day before which was 93.24 on the 30min chart which I had marked as a key level signaling a potential reversal.
Strategy Link: http://tos.mx/P3mxTl4 (Click Setup, Open Shared Item, Paste the Link)
Alternatively, to use the strategy code below (not the link above) click on the charts tab, studies button, edit studies, strategies tab, create, copy and paste the first code in and change the name at the top to your liking, click ok. Make sure to follow the rules on the first post regarding time frame, extended hours etc.
Watchlist Indicator: http://tos.mx/KDtke7m (Click Setup, Open Shared Item, Paste the Link)
For the watchlist custom indicator (again, the code is below not the link above) click the gear icon on your watchlist, customize, type in “custom”, click the small scroll looking icon to the left of an unused custom study, paste the second code in and change the name to your liking (something short), change the “D” to “5m” and check extended hours, click ok.
This is just the preview. More detailed instructions below.
I WILL ADD ALL UPDATES HERE! This strategy is changing and I don’t want to confuse anyone with comments from previous versions in the post below!!!
This is months of trial and error with different strategies and indicators. This is what I have found that works best as of today. I am continually updating this strategy to refine it and/or find better entries and exits. All updates will be posted here on Post #1.
This strategy USES two EMAs (5EMA, 12EMA), MACD, TSI, and Pre-Market High/Low. The EMAs are arranged in a cloud (5EMA / 12EMA). This strategy also INCLUDES but does not USE the 34EMA, 50EMA, and Yesterdays High/Low. These can be turned on and off to your liking.
The triggers I am using are:
Buy Signal only between 8:35 A.M. CST until 2:00 P.M. CST (This can be changed to fit your needs)
EMAs Bullish (5EMA>12EMA) or EMAs Bearish (5EMA<12EMA)
MACD Trending Up or MACD Trending Down
TSI >10 and trending up or TSI <-10 and trending down
Low > the Pre-Market High or High < the Pre-Market Low
Again, subject to change.
Of note, I use this for options so the wording I use in the strategy is geared towards that.
Gray Candles - Criteria Not Met
Red Candle - Put Buy or Sell to Open (Short) (Entry is on the 5EMA or When you get the Buy Bubble)
Light Red Candle - Put Hold or Short Hold
Green Candle - Call Buy or Buy to Open (Long) (Entry is on 5EMA or when you get the Buy Bubble)
Light Green Candle - Call Hold or Long Hold
Candle colors can be changed using the gear icon, scrolling to the very bottom and changing the “globals” settings.
Very basic instructions…
If you FOMO in at the beginning of the day without a buy signal, which you shouldn’t, and you get a Pink Boolean Arrow than GET OUT! The price is too extended from the EMA and you are just asked for a knife candle to kill your profits.
If you were patient and waited on the Buy Signal (white arrow) then get in on that 5EMA (green dashed line) or better. Alternatively, if you missed your entry, then try to get in at least on the white dash or better. This was the entry point from the previous candle.
You should not get a Buy Signal unless the price is already within the defined range of the 5EMA.
If you are confident in your order placing abilities and the spread isn’t too wide you can even set a trailing stop buy order to try to get the best price.
If you get a Pink Boolean Arrow then again, really think about taking profits.
This is a great spot for a trailing stop depending on the spread!
If you get a Grey Candle than get ready to close your trade at the open of the next bar. Don’t get in a hurry though because sometimes the candle will repaint and continue with your trend.
Rinse and Repeat. Don’t Get Fancy! Let It work or move on to a stock that is working!
The difference in my trading waiting on that 5EMA entry was a game changer. In options, if I rushed into a trade that gave me a buy signal before it came back to the 5EMA I might be down 50% within seconds before maybe recovering. However, if I wait on that 5 EMA entry I may never be down or at worst 15%-20% before becoming profitable.
I added labels to the top of the chart for each criteria this strategy is looking for. This will help you “get ready” to buy. If they are all red then get ready to go short or buy puts on that 5EMA. If they are all green than again, get ready to go long or buy calls on that 5EMA.
I THINK the labels should go green/blue from left to right if the stock cooperates. I have noticed that the biggest thing holding up the entry is MACD direction and price at the 5EMA at the same time but then again, that is what makes it mostly* dependable.
Once you are in the trade you can stop looking at the labels. At that point you are just waiting for the grey candle or pink boolean arrow for your exit.
WIth that being said, be careful with options and this study! I chose my stocks based on my 2+ years of trading experience and look at support/resistance to chose the right strike. I am excited about this strategy because every single backtest I ran on every ticker on my watchlist was profitable over the past 10 days when trading 100 shares at a time.
Few Rules:
To be used on 5 minute charts. That is all I have tested it on.
Must have Extended Hours on and I prefer 3 Day / 5 Min zoomed in.
Copy the code and paste it as a STRATEGY not study.
If you so choose, turn on the “Over Ext Clouds”. That is a take profit spot where you would get the pink boolean arrow.
There is no scanner yet but some users are trying to create one that works (one or two are floating around the comments now). I use a flexible grid with 16 charts and load the tickers that I am looking at that particular day. This allows for the fastest response for me personally. Link at the top.
Code:
#JT Newest Strategy Based on EMAs, TSI, Premarket Highs/Lows, and MACD
#VERSION 10.4 - 05/31/2022

#Notes

Declare Upper;

##################################################################
#                                OPTIONS                         #
##################################################################
input ShowTestBubbles = no;
input ShowFlexGridBackgroundColor = no;
input ShowColorDefLabels = yes;
input AlertOn = yes;
input Show200EMA = no;
input ShowFastEMALines = no;
input ShowFastEMACloud = no;
input ShowSlowEMALines = no;
input ShowSlowEMACloud = no;
input ShowPreMarketLines = no;
input ShowPreMarketCloud = no;
input ShowPreMarketLabel = yes;
input ShowPrevDayLines = no;
input ShowPrevDayCloud = no;
input ShowPrevHighLowLabel = no;
input ShowBuySellBubbles = no;
input ShowArrows = yes;
input ShowSquares = yes;
input ShowDashes = yes;
input ShowBooleanArrows = yes;
input ShowOverExtCloud = no;
input ShowTkPftBubble = no;
input ShowOrders = no;
input ShowTkPftOrders = no;

##################################################################
#                                COLORS                          #
##################################################################
DefineGlobalColor("200EMA", createcolor (255, 255, 255));
DefineGlobalColor("CloudUp", createcolor (102, 255, 102));
DefineGlobalColor("CloudDown", createcolor (255, 102, 102));
DefineGlobalColor("OpenLongPosition", createcolor (0, 255, 0));
DefineGlobalColor("OpenShortPosition", createcolor (255, 0, 0));
DefineGlobalColor("HoldLongPosition", createcolor (153, 255, 153));
DefineGlobalColor("HoldShortPosition", createcolor (255, 153, 153));
DefineGlobalColor("SellPosition", createcolor (255, 0, 0));
DefineGlobalColor("TakeProfit", createcolor (255, 0, 255));
DefineGlobalColor("CriteriaNotMet", createcolor (102, 102, 102)); #(255, 255, 0)

##################################################################
#                                 TIMES                          #
##################################################################
#START AND END TIMES
input TimeFrame = {default "5-Min", "1-Min", "10-Min", "15-Min", "30-Min", "1-Hour"};
input PreMarketStart = 0700; #EST
input PreMarketEnd = 0929; #EST
input StartTime = 0930; #EST
input BuySignalDelay = 0;
input EndTime = 1600; #EST
input BuySignalStop = 60; #Minutes Before End of Day
def LastCandleStop; #Last Candle is Sell Candle

        switch (TimeFrame) {
        case "1-min": LastCandleStop = 1;
        case "10-Min": LastCandleStop = 10;
        case "15-Min": LastCandleStop = 15;
        case "30-Min": LastCandleStop = 30;
        case "1-Hour": LastCandleStop = 60;
        default: LastCandleStop = 5;
        }

def TradingDayStart= SecondsFromTime(StartTime);
def BuySignalDelaySeconds = BuySignalDelay * 60;
def SignalStart = TradingDayStart > BuySignalDelaySeconds;
def TradingDayEnd = SecondsTillTime(EndTime);
def EndSignalDelaySeconds = BuySignalStop * 60;
def SignalEnd = TradingDayEnd > EndSignalDelaySeconds;
def TradingDay = SignalStart and SignalEnd; #10:00EST - 1500EST
def LastStopDelaySeconds = LastCandleStop * 60;
def EndDay = TradingDayEnd == LastStopDelaySeconds; #1550EST
def TradingDayExt = TradingDayEnd > LastStopDelaySeconds;

##################################################################
#                              INDICATORS                        #
##################################################################
#200 EMA
plot EMA200 = ExpAverage(HL2, 200);
EMA200.SetDefaultColor(globalcolor("200EMA"));
EMA200.HideBubble();
EMA200.sethiding(!Show200EMA);

#EMAS
input Ema1Length = 5;
input Ema2Length = 12;
input Ema3Length = 34;
input Ema4Length = 50;

plot EMA1 = ExpAverage(close, Ema1Length);
EMA1.SetStyle(Curve.Short_Dash);
EMA1.SetDefaultColor(globalcolor("CloudUp"));
EMA1.HideBubble();
#EMA1.sethiding(!ShowFastEMALines);
plot EMA2 = ExpAverage(close, Ema2Length);
EMA2.SetDefaultColor(globalcolor("CloudDown"));
EMA2.HideBubble();
EMA2.sethiding(!ShowFastEMALines);
AddCloud(if ShowFastEMACloud then EMA1 else double.nan, if ShowFastEMACloud then EMA2 else double.nan, globalcolor("CloudUp"), globalcolor("CloudDown"));
plot EMA3 = ExpAverage(close, Ema3Length);
EMA3.SetDefaultColor(globalcolor("CloudUp"));
EMA3.HideBubble();
EMA3.sethiding(!ShowSlowEMALines);
plot EMA4 = ExpAverage(close, Ema4Length);
EMA4.SetDefaultColor(globalcolor("CloudDown"));
EMA4.HideBubble();
EMA4.sethiding(!ShowSlowEMALines);
AddCloud(if ShowSlowEMACloud then EMA3 else double.nan, if ShowSlowEMACloud then EMA4 else double.nan, globalcolor("CloudUp"), globalcolor("CloudDown"));

    #EMAS BULLISH OR BEARISH
    def EMABullish = EMA1 > EMA2;
    def EMABearish = EMA1 < EMA2;

        #EMA PERCENT SEPERATION
        def EMAPctBull = ((EMA1 / EMA2) * 100) - 100; #Distance Between EMA1 and EMA2
        def EMAPctBullRound = Round(EMAPctBull, 2);
        def EMAPctBear = ((EMA2 / EMA1) * 100) - 100; #Distance Between EMA2 and EMA1
        def EMAPctBearRound = Round(EMAPctBear, 2);

        #FAST EMA PERCENT SEPERATION BUY SIGNAL
        def EMASepThrHld;
        switch (TimeFrame) {
        case "1-min": EMASepThrHld = 0.1;
        case "10-Min": EMASepThrHld = 0.25;
        case "15-Min": EMASepThrHld = 0.25;
        case "30-Min": EMASepThrHld = 0.3;
        case "1-Hour": EMASepThrHld = 0.3;
        default: EMASepThrHld = 0.2;
        }

        def EMAPctBullish = EMAPctBullRound > EMASepThrHld and EMAPctBullRound >= EMAPctBullRound[1];
        def EMAPctBearish = EMAPctBearRound > EMASepThrHld and EMAPctBearRound >= EMAPctBearRound[1];
        #TESTING
        addchartbubble(ShowTestBubbles and EMAPctBullish, High * 1.005, EMAPctBullRound, color.dark_green, yes);
        addchartbubble(ShowTestBubbles and EMAPctBearish, Low * 0.995, EMAPctBearRound, color.dark_red, no);

            #EMA SELL SIGNALS
            def EMACrossDown = EMA1 crosses below EMA2;
            def EMACrossUp = EMA1 crosses above EMA2;

#TSI
input TSILongLength = 25;
input TSIShortLength = 13;
input TSISignalLength = 8;

def TSIDiff = close - close[1];
def DoubleSmoothedAbsDiff = ExpAverage(ExpAverage(AbsValue(TSIDiff), TSILongLength), TSIShortLength);
def TSIRound = Round((100 * (ExpAverage(ExpAverage(TSIDiff, TSILongLength), TSIShortLength)) / DoubleSmoothedAbsDiff), 2);

    #TSI BUY SIGNAL
    def TSIBull = (TSIRound > TSIRound[2]); #(TSIRound > 10)
    def TSIBear = (TSIRound < TSIRound[2]); #(TSIRound < -10)

        #TSI SELL SIGNAL
        def TSICrossDown = TSIRound < (TSIRound[1] * 0.91);
        def TSICrossUp = TSIRound > (TSIRound[1] * 0.91);

#MACD
input MACDFast = 10;
input MACDSlow = 22;
input MACDLength = 8;

def MACDValue = ExpAverage(close, MACDFast) - ExpAverage(close, MACDSlow);
def MACDAverage = ExpAverage(MACDValue, MACDLength);
def MACDDiff = MACDValue - MACDAverage;
def ZeroLine = 0;

    #MACD BUY SIGNAL
    def MACDBull = TSIRound > MACDAverage; #(MACDAverage > MACDAverage[1]) within 3 bars;
    def MACDBear = TSIRound < MACDAverage; #(MACDAverage < MACDAverage[1]) within 3 bars;

#TSI AND MACD SELL SIGNAL
def TSIMACDLongSell = TSIRound crosses below MACDAverage;
def TSIMACDShortSell = TSIRound crosses above MACDAverage;

##################################################################
#                          PREMARKET                             #
##################################################################
#PREMARKET HIGHS AND LOWS
def PreMarketTimeRange = secondsFromTime(PreMarketStart) >= 0 and secondsTillTime(PreMarketEnd) >= 0;
def PreMarket = PreMarketTimeRange and !PremarketTimeRange[1];
def Pre_Market_High = compoundValue(1, if((high > Pre_Market_High[1] and PremarketTimeRange) or PreMarket, high, Pre_Market_High[1]), high);
def Pre_Market_Low = compoundValue(1, if((low < Pre_Market_Low[1] and PremarketTImeRange) or PreMarket, low, Pre_Market_Low[1]), low);

plot PreMarketHigh = Pre_Market_High;
PreMarketHigh.SetStyle(curve.short_dash);
PreMarketHigh.SetDefaultColor(color.light_gray);
PreMarketHigh.Sethiding(!ShowPreMarketLines);
plot PreMarketLow = Pre_Market_Low;
PreMarketLow.SetStyle(curve.short_dash);
PreMarketLow.SetDefaultColor(color.light_gray);
PreMarketLow.Sethiding(!ShowPreMarketLines);
AddCloud(if ShowPreMarketCloud then PreMarketHigh else double.nan, if ShowPreMarketCloud then PreMarketLow else double.nan, color.light_gray, color.light_gray);

AddLabel(if ShowPreMarketLabel then yes else no, "   ", color.black);
AddLabel(if ShowPreMarketLabel then yes else no, " PM High - $" + PreMarketHigh + " ", color.gray);
AddLabel(if ShowPreMArketLabel then yes else no, " PM Low - $" + PreMarketLow + " ", color.gray);

    #PREMARKET HIGH/LOW BUY SIGNAL
    def PreMarketBull = close > Pre_Market_High;
    def PreMarketBear = close < Pre_Market_Low;

        #PREMARKET HIGH/LOW SELL SIGNAL
        def PreMarketBullSell = PreMarketBull[1] and low < Pre_Market_High;
        def PreMarketBearSell = PreMarketBear[1] and high > Pre_Market_Low;

##################################################################
#                      YESTERDAY HIGH/LOW                        #
##################################################################
plot PrevHigh = high(period = "day")[1];
PrevHigh.SetStyle(curve._dash);
PrevHigh.SetDefaultColor(Color.GREEN);
PrevHigh.Sethiding(!ShowPrevDayLines);
plot PrevLow = low(period = "day")[1];
PrevLow.SetStyle(curve._dash);
PrevLow.SetDefaultColor(Color.GREEN);
PrevLow.Sethiding(!ShowPrevDayLines);
AddCloud(if ShowPrevDayCloud then PrevHigh else double.nan, if ShowPrevDayCloud then PrevLow else double.nan, color.light_gray, color.light_gray);

AddLabel(if ShowPrevHighLowLabel then 1 else 0, "   ", color.black);
AddLabel(if ShowPrevHighLowLabel then 1 else 0, "Prev High " + "$ " + PrevHigh + " ", color.gray);
AddLabel(if ShowPrevHighLowLabel then 1 else 0, "Prev Low " + "$ " + PrevLow + " ", color.gray);

##################################################################
#                               SIGNALS                          #
##################################################################
#INDICATOR BUY SIGNALS
def LongBuyInd = TradingDay and EMABullish and EMAPctBullish and MACDBull and TSIBull and PreMarketBull;
def ShortBuyInd = TradingDay and EMABearish and EMAPctBearish and MACDBear and TSIBear and PreMarketBear;

plot LongEntryLine = if (LongBuyInd[1] or LongBuyInd[2]) and ShowDashes and LongBuyInd then EMA1[1] * 1.0025 else double.nan;
LongEntryLine.SetPaintingStrategy(PaintingStrategy.Dashes);
LongEntryLine.SetDefaultColor(color.white);
LongEntryLine.SetLineWeight(3);
plot ShortEntryLine = if (ShortBuyInd[1] or ShortBuyInd[2]) and ShowDashes and ShortBuyInd then EMA1[1] * 0.9975 else double.nan;
ShortEntryLine.SetPaintingStrategy(PaintingStrategy.Dashes);
ShortEntryLine.SetDefaultColor(color.white);
ShortEntryLine.SetLineWeight(3);

#INDICATOR ENTRY SIGNALS
def LongEntryInd = (LongBuyInd[1] or LongBuyInd[2]) and LongBuyInd and low <= (EMA1 * 1.0025);
def ShortEntryInd = (ShortBuyInd[1] or ShortBuyInd[2]) and ShortBuyInd and high >= (EMA1 * 0.9975);

#INDICATOR HOLD SIGNALS
def LongHoldInd = TradingDayExt and PreMarketBull and (LongBuyInd[1] or LongHoldInd[1]);
def ShortHoldInd = TradingDayExt and PreMarketBear and (ShortBuyInd[1] or ShortHoldInd[1]);

##################################################################
#         ADDED FAST EMA PCT HERE BASED OFF BUY SIGNAL           #
##################################################################
            def EMAPctAtLongBuy = if LongEntryInd then EMAPctBullRound else EMAPctAtLongBuy[1];
            def EMAPctAtShortBuy = if ShortEntryInd then EMAPctBearRound else EMAPctAtShortBuy[1];

                #FAST EMA CLOUD SELL TRIGGER BASED OFF BUY INDICATOR
                input EMAPctDecFromBuy = 0.6;
                def LongEMAPctSell = EMAPctBullRound < (EMAPctAtLongBuy * EMAPctDecFromBuy);
                def ShortEMAPctSell = EMAPctBearRound < (EMAPctAtShortBuy * EMAPctDecFromBuy);

##################################################################
#                         SIGNALS CONT.                          #
##################################################################
    #SELL SIGNALS
    def LongPriceActSell = low < low[4];
    def ShortPriceActSell = high > high[4];
    def LongSellInd = TradingDayExt and (close < open) and close < EMA1 and LongPriceActSell and close < EMA2 and (EMACrossDown or TSICrossDown or LongEMAPctSell or TSIMACDLongSell);
    def ShortSellInd = TradingDayExt and (close > open) and close > EMA1 and ShortPriceActSell and close > EMA2 and (EMACrossUp or TSICrossUp or ShortEMAPctSell or TSIMACDShortSell);
        #TESTING
        addchartbubble(ShowTestBubbles and TSICrossDown, High * 1.005, "T-Dn", color.dark_green, yes);
        addchartbubble(ShowTestBubbles and TSICrossUp, Low * 0.995, "T-Up", color.dark_red, no);
        addchartbubble(ShowTestBubbles and EMACrossDown, High * 1.005, "E-X-Dn", color.dark_green, yes);
        addchartbubble(ShowTestBubbles and EMACrossUp, Low * 0.995, "E-X-Up", color.dark_red, no);
        addchartbubble(ShowTestBubbles and LongEMAPctSell, High * 1.005, "E-Pct-Dn", color.dark_green, yes);
        addchartbubble(ShowTestBubbles and SHortEMAPctSell, Low * 0.995, "E-Pct-Up", color.dark_red, no);

    #HOLD SIGNALS
    def LongHoldInd2 = LongHoldInd and !LongSellInd;
    def ShortHoldInd2 = ShortHoldInd and !ShortSellInd;

##################################################################
#                                 BARS                           #
##################################################################
AssignPriceColor(if LongBuyInd then GlobalColor("OpenLongPosition") else if ShortBuyInd then GlobalColor("OpenShortPosition") else if LongHoldInd2 then GlobalColor("HoldLongPosition") else if ShortHoldInd2 then GlobalColor("HoldShortPosition") else GlobalColor("CriteriaNotMet"));

##################################################################
# EMA TAKE PROFIT CLOUD (IDENTIFY IF PRICE IS EXTENDED FROM EMAS)#
##################################################################
            def OvrExtUp1 = if ShowOverExtCloud and SignalStart and TradingDayExt and (LongEntryInd or LongHoldInd2) then EMA1 * 1.01 else Double.NaN;
            def OvrExtUp2 = if ShowOverExtCloud and SignalStart and TradingDayExt and (LongEntryInd or LongHoldInd2) then EMA1 * 1.02 else Double.NaN;
            AddCloud(OvrExtUp1, OvrExtUp2, color.light_green, color.light_green);
            def OvrExtDn1 = if ShowOverExtCloud and SignalStart and TradingDayExt and (ShortEntryInd or ShortHoldInd2) then EMA1 * 0.99 else Double.NaN;
            def OvrExtDn2 = if ShowOverExtCloud and SignalStart and TradingDayExt and (ShortEntryInd or ShortHoldInd2) then EMA1 * 0.98 else Double.NaN;
            AddCloud(OvrExtDn1, OvrExtDn2, color.light_green, color.light_green);

##################################################################
#                                LABELS                          #
##################################################################
#LABELS
AddLabel(yes, "     ", color.black);
AddLabel(yes, "PREMKT", if PreMarketBull then GlobalColor("OpenLongPosition") else if PreMarketBear then GlobalColor("OpenShortPosition") else color.gray);
AddLabel(yes, "CLOUD", if EMABullish then GlobalColor("OpenLongPosition") else if EMABearish then GlobalColor("OpenShortPosition") else color.gray);
AddLabel(yes, "EMA SEP", if EMAPctBullish then GlobalColor("OpenLongPosition") else if EMAPctBearish then GlobalColor("OpenShortPosition") else color.gray);
AddLabel(yes, "TSI", if TSIBull then GlobalColor("OpenLongPosition") else if TSIBear then GlobalColor("OpenShortPosition") else color.gray);
AddLabel(yes, "MACD", if MACDBull then GlobalColor("OpenLongPosition") else if MACDBear then GlobalColor("OpenShortPosition") else color.gray);

##################################################################
#               CHART BUBBLES/POINTS FOR BUY/SELL                #
##################################################################
#BUY
def LongBuyBub = LongEntryInd;
addchartbubble(ShowBuySellBubbles and LongBuyBub, High * 1.005, "Long", color.green, yes);
def ShortBuyBub = ShortEntryInd;
addchartbubble(ShowBuySellBubbles and ShortBuyBub, Low * 0.995, "Short", color.red, no);

plot LongBuyPoint = if ShowArrows and LongBuyBub then EMA1[1] else double.nan;
LongBuyPoint.SetDefaultColor(color.white);
LongBuyPoint.SetPaintingStrategy(PaintingStrategy.Arrow_Up);
LongBuyPoint.SetLineWeight(5);
LongBuyPoint.HideBubble();
plot ShortBuyPoint = if ShowArrows and ShortBuyBub then EMA1[1] else double.nan;
ShortBuyPoint.SetDefaultColor(color.white);
ShortBuyPoint.SetPaintingStrategy(PaintingStrategy.Arrow_Down);
ShortBuyPoint.SetLineWeight(5);
ShortBuyPoint.HideBubble();

#SELL
def LongSellBub = (LongEntryInd[1] or LongHoldInd2[1]) and (LongEntryInd[2] or LongHoldInd2[2]) and LongSellInd;
addchartbubble(ShowBuySellBubbles and LongSellBub, High * 1.005, "Sell", color.red, yes);
def ShortSellBub = (ShortEntryInd[1] or ShortHoldINd2[1]) and (ShortEntryInd[2] or ShortHoldINd2[2]) and ShortSellInd;
addchartbubble(ShowBuySellBubbles and ShortSellBub, Low * 0.995, "Sell", color.green, no);

plot LongSellPoint = if ShowSquares and LongSellBub then Close else double.nan;
LongSellPoint.SetDefaultColor(color.red);
LongSellPoint.SetPaintingStrategy(PaintingStrategy.Squares);
LongSellPoint.SetLineWeight(5);
LongSellPoint.HideBubble();
plot ShortSellPoint = if ShowSquares and ShortSellBub then Close else double.nan;
ShortSellPoint.SetDefaultColor(color.green);
ShortSellPoint.SetPaintingStrategy(PaintingStrategy.Squares);
ShortSellPoint.SetLineWeight(5);
ShortSellPoint.HideBubble();

#TAKE PROFIT
def LongTkPftBub = TradingDayExt and (LongEntryInd or LongHoldInd2) and high > EMA1 * 1.01;
addchartbubble(ShowTkPftBubble and LongTkPftBub, high * 1.001, "Tk Pft", GlobalColor("TakeProfit"), yes);
def ShortTkPftBub = TradingDayExt and (ShortEntryInd or ShortHoldInd2) and low < EMA1 * 0.99;
addchartbubble(ShowTkPftBubble and ShortTkPftBub, low * 0.999, "Tk Pft", GlobalColor("TakeProfit"), no);

plot LongTkPftPoint = if ShowBooleanArrows and LongTkPftBub then High else double.nan;
LongTkPftPoint.SetDefaultColor(GlobalColor("TakeProfit"));
LongTkPftPoint.SetPaintingStrategy(PaintingStrategy.Boolean_Wedge_Up);
LongTkPftPoint.SetLineWeight(5);
LongTkPftPoint.HideBubble();
plot ShortTkPftPoint = if ShowBooleanArrows and ShortTkPftBub then Low else double.nan;
ShortTkPftPoint.SetDefaultColor(GlobalColor("TakeProfit"));
ShortTkPftPoint.SetPaintingStrategy(PaintingStrategy.Boolean_Wedge_Down);
ShortTkPftPoint.SetLineWeight(5);
ShortTkPftPoint.HideBubble();

##################################################################
#                             STOP LOSS                          #
##################################################################
def longstop = if (open < close) then open else close;
def shortstop = if (open > close) then open else close;
addlabel(if (LongBuyInd or LongHoldInd2) then yes else no, "STOP $ " + longstop[4] + " ", color.white);
addlabel(if (ShortBuyInd or ShortHoldInd2) then yes else no, "STOP $ " + shortstop[4] + " ", color.white);

##################################################################
#                                ORDERS                          #
##################################################################
def orderQuantity = Round(10000 / open, 0);

#BUY ORDERS
AddOrder(OrderType.BUY_TO_OPEN, ShowOrders and LongEntryInd, EMA1 * 1.0025, 100, Color.GREEN, Color.LIGHT_GREEN);
AddOrder(OrderType.SELL_TO_OPEN, ShowOrders and ShortEntryInd, EMA1 * 0.9975, 100, Color.GREEN, Color.LIGHT_GREEN);

#SELL ORDERS
AddOrder(OrderType.SELL_TO_CLOSE, ShowOrders and ShowTkPftOrders and LongTkPftBub, high * 0.999, 100, Color.RED, Color.LIGHT_RED);
AddOrder(OrderType.SELL_TO_CLOSE, ShowOrders and (LongSellInd or EndDay[-1]), open[-1], 100, Color.RED, Color.LIGHT_RED);
AddOrder(OrderType.BUY_TO_CLOSE, ShowOrders and ShowTkPftOrders and ShortTkPftBub, low * 1.001, 100, Color.RED, Color.LIGHT_RED);
AddOrder(OrderType.BUY_TO_CLOSE, ShowOrders and (ShortSellInd or EndDay[-1]), open[-1], 100, Color.RED, Color.LIGHT_RED);
##################################################################
#                                ALERTS                          #
##################################################################
Alert(AlertOn and (LongSellBub or ShortSellBub or LongTkPftBub or ShortTkPftBub), "SELL" + GetSymbol(), Alert.BAR, Sound.Bell);
Alert(AlertOn and (LongBuyInd or ShortBuyInd), "BUY" + GetSymbol(), Alert.BAR, Sound.Chimes);

##################################################################
#                       CANDLE COLOR LABEL                       #
##################################################################
AddLabel(if ShowColorDefLabels == 1 then yes else no, "     ", color.black);
AddLabel(if ShowColorDefLabels == 1 then yes else no, "Long Ind", GlobalColor("OpenLongPosition"));
AddLabel(if ShowColorDefLabels == 1 then yes else no, "Long Hld", GlobalColor("HoldLongPosition"));
AddLabel(if ShowColorDefLabels == 1 then yes else no, "Short Ind", GlobalColor("OpenShortPosition"));
AddLabel(if ShowColorDefLabels == 1 then yes else no, "Short Hld", GlobalColor("HoldShortPosition"));
AddLabel(if ShowColorDefLabels == 1 then yes else no, "No Criteria", GlobalColor("CriteriaNotMet"));

##################################################################
#                BACKGROUND COLOR FOR FLEX GRID                  #
##################################################################
AssignBackgroundColor(if ShowFlexGridBackgroundColor and LongBuyInd then GlobalColor("OpenLongPosition") else if ShowFlexGridBackgroundColor and ShortBuyInd then GlobalColor("OpenShortPosition") else if ShowFlexGridBackgroundColor and (LongTkPftBub or ShortTkPftBub) then GlobalColor("TakeProfit") else color.current);
And last but not least, my watchlist indicator. I only use this to visually tell me when to take a closer look at a stock. I have whittled down my watchlist to ones that I know move and have plenty of options flow. Make sure your watchlist study is set to 5 Min and Extended Hours are turned On.
The numbers mean nothing. It is just my way of sorting. You can change the labels to whatever you want in the bottom of the code under “Label”
You will only get a signal on the chart and the watchlist between 8:35 A.M. CST and 2:55 P.M. CST.
Code:
#JT Newest Strategy Based on EMAs, TSI, Premarket Highs/Lows, and MACD
#VERSION 10.3 - 05/26/2022

#Notes

##################################################################
#                                 TIMES                          #
##################################################################
#START AND END TIMES
def PreMarketStart = 0700; #EST
def PreMarketEnd = 0929; #EST
def StartTime = 0930; #EST
def BuySignalDelay = 0;
def EndTime = 1600; #EST
def BuySignalStop = 60; #Minutes Before End of Day
def LastCandleStop = 5; #Last Candle is Sell Candle


def TradingDayStart= SecondsFromTime(StartTime);
def BuySignalDelaySeconds = BuySignalDelay * 60;
def SignalStart = TradingDayStart > BuySignalDelaySeconds;
def TradingDayEnd = SecondsTillTime(EndTime);
def EndSignalDelaySeconds = BuySignalStop * 60;
def SignalEnd = TradingDayEnd > EndSignalDelaySeconds;
def TradingDay = SignalStart and SignalEnd; #10:00EST - 1500EST
def LastStopDelaySeconds = LastCandleStop * 60;
def EndDay = TradingDayEnd == LastStopDelaySeconds; #1550EST
def TradingDayExt = TradingDayEnd > LastStopDelaySeconds;

##################################################################
#                              INDICATORS                        #
##################################################################
#200 EMA
def EMA200 = ExpAverage(HL2, 200);

#EMAS
def Ema1Length = 5;
def Ema2Length = 12;

def EMA1 = ExpAverage(close, Ema1Length);
def EMA2 = ExpAverage(close, Ema2Length);

    #EMAS BULLISH OR BEARISH
    def EMABullish = EMA1 > EMA2;
    def EMABearish = EMA1 < EMA2;

        #EMA PERCENT SEPERATION
        def EMAPctBull = ((EMA1 / EMA2) * 100) - 100; #Distance Between EMA1 and EMA2
        def EMAPctBullRound = Round(EMAPctBull, 2);
        def EMAPctBear = ((EMA2 / EMA1) * 100) - 100; #Distance Between EMA2 and EMA1
        def EMAPctBearRound = Round(EMAPctBear, 2);

        def EMAPctBullish = EMAPctBullRound > 0.2 and EMAPctBullRound >= EMAPctBullRound[1];
        def EMAPctBearish = EMAPctBearRound > 0.2 and EMAPctBearRound >= EMAPctBearRound[1];

            #EMA SELL SIGNALS
            def EMACrossDown = EMA1 crosses below EMA2;
            def EMACrossUp = EMA1 crosses above EMA2;

#TSI
def TSILongLength = 25;
def TSIShortLength = 13;
def TSISignalLength = 8;

def TSIDiff = close - close[1];
def DoubleSmoothedAbsDiff = ExpAverage(ExpAverage(AbsValue(TSIDiff), TSILongLength), TSIShortLength);
def TSIRound = Round((100 * (ExpAverage(ExpAverage(TSIDiff, TSILongLength), TSIShortLength)) / DoubleSmoothedAbsDiff), 2);

    #TSI BUY SIGNAL
    def TSIBull = (TSIRound > TSIRound[2]); #(TSIRound > 10)
    def TSIBear = (TSIRound < TSIRound[2]); #(TSIRound < -10)

        #TSI SELL SIGNAL
        def TSICrossDown = TSIRound < (TSIRound[1] * 0.91);
        def TSICrossUp = TSIRound > (TSIRound[1] * 0.91);

#MACD
def MACDFast = 10;
def MACDSlow = 22;
def MACDLength = 8;

def MACDValue = ExpAverage(close, MACDFast) - ExpAverage(close, MACDSlow);
def MACDAverage = ExpAverage(MACDValue, MACDLength);
def MACDDiff = MACDValue - MACDAverage;
def ZeroLine = 0;

    #MACD BUY SIGNAL
    def MACDBull = TSIRound > MACDAverage; #(MACDAverage > MACDAverage[1]) within 3 bars;
    def MACDBear = TSIRound < MACDAverage; #(MACDAverage < MACDAverage[1]) within 3 bars;

#TSI AND MACD SELL SIGNAL
def TSIMACDLongSell = TSIRound crosses below MACDAverage;
def TSIMACDShortSell = TSIRound crosses above MACDAverage;

##################################################################
#                          PREMARKET                             #
##################################################################
#PREMARKET HIGHS AND LOWS
def PreMarketTimeRange = secondsFromTime(PreMarketStart) >= 0 and secondsTillTime(PreMarketEnd) >= 0;
def PreMarket = PreMarketTimeRange and !PremarketTimeRange[1];
def Pre_Market_High = compoundValue(1, if((high > Pre_Market_High[1] and PremarketTimeRange) or PreMarket, high, Pre_Market_High[1]), high);
def Pre_Market_Low = compoundValue(1, if((low < Pre_Market_Low[1] and PremarketTImeRange) or PreMarket, low, Pre_Market_Low[1]), low);

def PreMarketHigh = Pre_Market_High;
def PreMarketLow = Pre_Market_Low;

    #PREMARKET HIGH/LOW BUY SIGNAL
    def PreMarketBull = close > Pre_Market_High;
    def PreMarketBear = close < Pre_Market_Low;

        #PREMARKET HIGH/LOW SELL SIGNAL
        def PreMarketBullSell = PreMarketBull[1] and low < Pre_Market_High;
        def PreMarketBearSell = PreMarketBear[1] and high > Pre_Market_Low;

##################################################################
#                               SIGNALS                          #
##################################################################
#INDICATOR BUY SIGNALS
def LongBuyInd = TradingDay and EMABullish and EMAPctBullish and MACDBull and TSIBull and PreMarketBull;
def ShortBuyInd = TradingDay and EMABearish and EMAPctBearish and MACDBear and TSIBear and PreMarketBear;

#INDICATOR ENTRY SIGNALS
def LongEntryInd = (LongBuyInd[1] or LongBuyInd[2]) and LongBuyInd and low <= (EMA1 * 1.0025);
def ShortEntryInd = (ShortBuyInd[1] or ShortBuyInd[2]) and ShortBuyInd and high >= (EMA1 * 0.9975);

#INDICATOR HOLD SIGNALS
def LongHoldInd = TradingDayExt and PreMarketBull and (LongBuyInd[1] or LongHoldInd[1]);
def ShortHoldInd = TradingDayExt and PreMarketBear and (ShortBuyInd[1] or ShortHoldInd[1]);

##################################################################
#         ADDED FAST EMA PCT HERE BASED OFF BUY SIGNAL           #
##################################################################
            def EMAPctAtLongBuy = if LongEntryInd then EMAPctBullRound else EMAPctAtLongBuy[1];
            def EMAPctAtShortBuy = if ShortEntryInd then EMAPctBearRound else EMAPctAtShortBuy[1];

                #FAST EMA CLOUD SELL TRIGGER BASED OFF BUY INDICATOR
                def LongEMAPctSell = EMAPctBullRound < (EMAPctAtLongBuy * 0.6);
                def ShortEMAPctSell = EMAPctBearRound < (EMAPctAtShortBuy * 0.6);

##################################################################
#                         SIGNALS CONT.                          #
##################################################################
    #SELL SIGNALS
    def LongPriceActSell = low < low[4];
    def ShortPriceActSell = high > high[4];
    def LongSellInd = TradingDayExt and (close < open) and (EMACrossDown or TSICrossDown or LongEMAPctSell or LongPriceActSell or TSIMACDLongSell);
    def ShortSellInd = TradingDayExt and (close > open) and (EMACrossUp or TSICrossUp or ShortEMAPctSell or ShortPriceActSell or TSIMACDShortSell);

    #HOLD SIGNALS
    def LongHoldInd2 = LongHoldInd and !LongSellInd;
    def ShortHoldInd2 = ShortHoldInd and !ShortSellInd;

##################################################################
#               CHART BUBBLES/POINTS FOR BUY/SELL                #
##################################################################
#TAKE PROFIT
def LongTkPftBub = TradingDayExt and (LongEntryInd or LongHoldInd2) and high > EMA1 * 1.01;
def ShortTkPftBub = TradingDayExt and (ShortEntryInd or ShortHoldInd2) and low < EMA1 * 0.99;

##################################################################
#                        WATCHLIST INDICATOR                     #
##################################################################

#LABEL
AddLabel(yes, if LongBuyInd then "1. LONG" else if LongHoldInd2 then "4. LONG HOLD" else if ShortBuyInd then "2. SHORT" else if ShortHoldInd2 then "5. SHORT HOLD" else if LongTkPftBub or ShortTkPftBub then "3. TAKE PROFIT" else "6. NO GO");

#BACKGROUND
AssignBackgroundColor(if LongBuyInd then createcolor (0, 255, 0) else if LongHoldInd2 then createcolor (153, 255, 153) else if ShortBuyInd then createcolor (255, 0, 0) else if ShortHoldInd2 then createcolor (255, 153, 153) else if LongTkPftBub or ShortTkPftBub then createcolor (255, 0, 255) else createcolor (102, 102, 102));
What can go wrong….?
See the chart below. You will notice green candles which means all criteria to buy are met EXCEPT the price being within the defined range of the 5EMA. Because the price is extended, you didn’t get a white arrow. If you FOMO’d in, get out on the pink boolean arrow. You will notice after 5 minutes the price sharply reverses down and below the 5EMA. The price eventually normalizes and starts a gradual uptrend. You would do your best to enter on the candle with the white arrow, as close as possible to the 5EMA and definitely below the white dash. You would then wait for a grey candle to completely close and then exit at the open of the following candle.
I didn’t just pull that over extended cloud out of nowhere. That was me looking at multiple charts and coming up with the best number (probably has something to do with other algos).
To the right is what it’s supposed to look like.
Some light backtesting here. This is over 90 days and BEFORE I backtested with the pink boolean arrows.
If you happen to have something of value to add please don’t hesitate to post that here. This is however about 6 months of trial and error in the making.
###################################################################################
This is how I trade personally. Do whatever you want with this information.
Step 1. Before pre-market opens if I am awake. I look at the futures to get an idea of the direction of the market and VIX futures. So I am following the rules of the site. Here are the links to the two watchlist columns below. Not pertinent at this point. MT5 - http://tos.mx/4hzwiEn MT30 - http://tos.mx/45R1EOH
Step 2. Look at my watchlist throughout the premarket to get an idea on what is running or what sectors may be in play. This comes with experience. I am strictly looking at percent gain or percent loss.
Step 3. Pick a few stocks that I think I want to trade. That may be based on news, pre-market action, recent earnings, some Elon Must Twitter post etc. I want something that is going to move! I would highly prefer that it move with the sector and with the futures and/or index it’s trading in.
Step 4. Look at the daily charts of the tickers that you like. This is my main screen and what I traded today 5/31/22. My thought was that OXY would go down because the price was so extended from the 5EMA on the daily chart. (I scrolled to the premarket to show what I saw. Obviously can’t do that with the daily candle.) More to come on those histograms on the bottom. TSI and MACD Line - http://tos.mx/91sbV6M and TSI and MACD Histogram - http://tos.mx/5fBU0TW
Step 5. Wait for your bias to play out or admit that you’re wrong and look for another opportunity.
Step 6. Review the Chart Below for what I saw around 0910 CST. My direction is correct but I don’t quite like that the 30 minute is not there yet. Lets wait a bit… In the mean time lets get a price target. $68 Put looks good because that is where the 5EMA is at. Be patient.
Step 7. 30 Minute Histogram is nearing 0 and still declining. I’m about ready to enter but I have to wait on the white arrow to appear and buy as close to the 5EMA as possible.
Step 8. Now I switch to my flex grid where I have the 5 minute, 30 minute, 5 minute option that I want to buy, and active trader up. That way I am ready to pounce when the signal hits.
Step 9. Buy. Don’t hesitate. You did the work, now follow through! I entered at $0.45 per contract.
Step 10. Wait for your Exit. You could have exited on the pink boolean candle on the 30 minute chart. I did not. Profits would have been about the same.
Step 11. Take your 150% profit and enjoy your day!
Can someone help with this background color code problem I like to be able to control the opacity
As you can see in the picture when the code activates the background it covers the chart info
I try to do it according to @MerryDay workarounds I was unsuccessful.
Thanks
##################################################################
# BACKGROUND COLOR FOR FLEX GRID #
##################################################################
AssignBackgroundColor(if ShowFlexGridBackgroundColor and LongBuyInd then GlobalColor(“OpenLongPosition”) else if ShowFlexGridBackgroundColor and ShortBuyInd then GlobalColor(“OpenShortPosition”) else if ShowFlexGridBackgroundColor and (LongTkPftBub or ShortTkPftBub) then GlobalColor(“TakeProfit”) else color.current);
Is there a way to rewrite the code give me a ‘hint" because I try all you recommendations with no success unless am doing it wrong since am not a coder. Wink ;)Frown :(
Is there a way to rewrite the code give me a ‘hint" because I try all you recommendations with no success unless am doing it wrong since am not a coder. Wink ;)Frown :(
The code is what needs to be changed, not the transparency.
The code is written to color the chart background be the same as the labels, bubbles, and other elements that you are trying to see.
It is not possible to see red labels, red candles, or red anything on a red background. Same for the green background.
Here is code to make the background different from the elements.
Replace all lines after “BACKGROUND COLOR FOR FLEX GRID” with this:
Ruby:
1
################################################################## # BACKGROUND COLOR FOR FLEX GRID # ################################################################## DefineGlobalColor("ChartLong", createcolor (200, 200, 255)); DefineGlobalColor("ChartShort", createcolor (255, 200, 155)); DefineGlobalColor("ChartProfit", createcolor (0, 0, 255)); AssignBackgroundColor(if ShowFlexGridBackgroundColor and LongBuyInd then GlobalColor("ChartLong") else if ShowFlexGridBackgroundColor and ShortBuyInd then GlobalColor("ChartShort") else if ShowFlexGridBackgroundColor and (LongTkPftBub or ShortTkPftBub) then GlobalColor("ChartProfit") else color.current);
You can change the global colors: ChartLong, ChartShort, ChartProfit to anything you want. But keep in mind that if you use anything from the red or green color families, it will obscure the chart elements.
(click on save as default, so you won’t have to make the change every time you make a new grid).
Thank you MerryDay that’s exactly what i was looking for