布林线口诀的要点:
1、三线向上,中轨进,上轨出
2、三线向下,下轨进,中轨出
3、三轨走平,下轨进,上轨出
python 安装使用 TA-lib
安装主要在 http://www.lfd.uci.edu/~gohlke/pythonlibs/
这个网站找到
TA_Lib-0.4.24-cp310-cp310-win_amd64.whl
pip install /pypi/TA_Lib-0.4.24-cp310-cp310-win_amd64.whl
编写 talib_boll_obv.py 如下
 1
 2
 3
 4
 5
 6
 7
 8
 9
10
11
12
13
14
15
16
17
18
19
20
21
22
23
24
25
26
27
28
29
30
31
32
33
34
35
36
37
38
39
40
41
42
43
44
45
46
47
48
49
50
51
52
53
54
55
56
57
58
59
60
61
62
63
64
65
|
import os

import sys

import matplotlib.pyplot as plt

import pandas as pd

import tushare as ts

import talib

if len(sys.argv) ==2:

code = sys.argv[1]

else:

print('usage: python talib_boll_obv.py stockcode ')

sys.exit(1)

if len(code) !=6:

print('stock code length: 6')

sys.exit(2)

df = ts.get_k_data(code, start='2023-01-01')

if len(df) <30:

print(" len(df) <30 ")

sys.exit(2)

close = df['close'].values

df['upper'], df['mid20'], df['lower'] = talib.BBANDS(close,

timeperiod=20, nbdevup=2, nbdevdn=2, matype=0)

df['obv'] = talib.OBV(df.close, df.volume)

d2 = df[ df['date'] >'2023-05-01']

print(" 向上突破 upper")

print(d2[ d2.close > d2.upper ])

print(" 向下突破 lower")

print(d2[ d2.close < d2.lower ])

d2.index = pd.to_datetime(d2.date)

fig,axes = plt.subplots(2,1)

d2[['close','upper','mid20','lower']].plot(ax=axes[0], grid=True, title=code)

d2[['obv']].plot(ax=axes[1], grid=True)

plt.legend(loc='best', shadow=True)

plt.show()
|
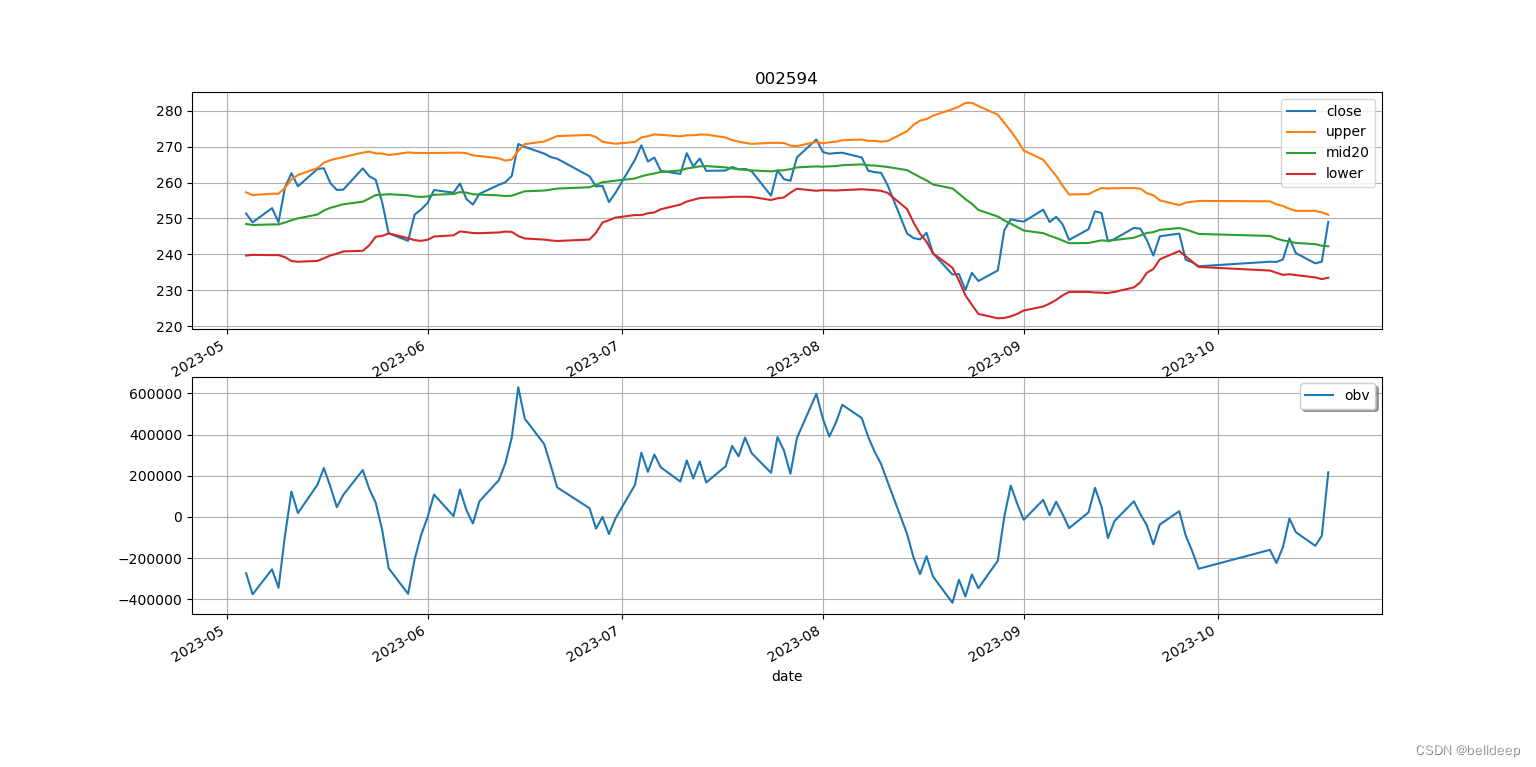
运行 python talib_boll_obv.py 002594
# 画基金净值-布林线图
编写 talib_boll.py 如下
 1
 2
 3
 4
 5
 6
 7
 8
 9
10
11
12
13
14
15
16
17
18
19
20
21
22
23
24
25
26
27
28
29
30
31
32
33
34
35
36
37
38
39
40
41
42
43
44
45
46
47
48
49
50
51
52
53
54
55
56
57
58
59
60
61
62
63
64
65
|
import os

import sys

import tushare as ts

import pandas as pd

import matplotlib.pyplot as plt

import numpy as np

import talib

if len(sys.argv) ==2:

fcode = sys.argv[1]

else:

print('usage: python talib_boll.py fundcode ')

sys.exit(1)

if len(fcode) !=6:

print('fund code length: 6')

sys.exit(2)

plt.rcParams['font.sans-serif'] = [u'SimHei']

plt.rcParams['axes.unicode_minus'] = False

f1 = fcode +'.csv'

if not os.path.exists(f1):

print("Error: %s not found." % f1)

sys.exit(3)

df = pd.read_csv(f1, parse_dates=True, index_col=0 )

if len(df) <30:

print(" len(df) <30 ")

sys.exit(4)

jz = df['jz'].values

df['upper'], df['mid20'], df['lower'] = talib.BBANDS(jz,

timeperiod=20, nbdevup=2, nbdevdn=2, matype=0)

df2 = df[ df.index >'2022-01-01']

print(df2.tail(5))

df2[['jz','upper','mid20','lower']].plot(grid=True, title=fcode)

plt.legend(loc='best', shadow=True)

plt.show()
|
运行 python talib_boll.py 014423