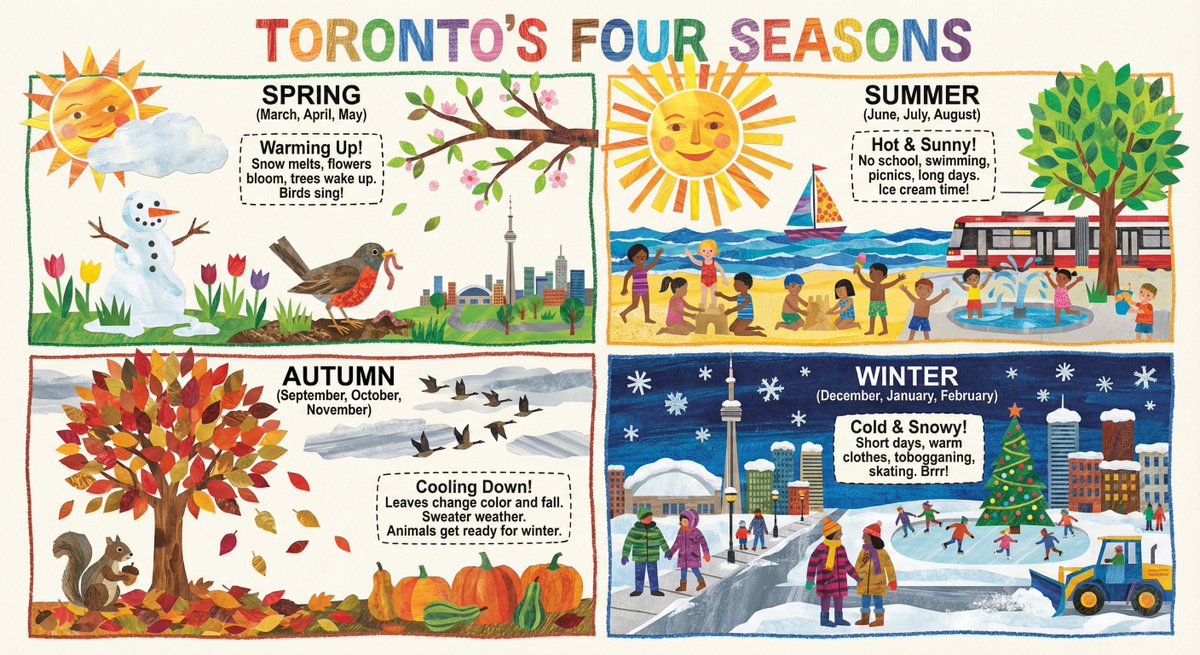
generate a detailed infographic that explains the 4 seasons as experienced in Toronto, Canada. The i
generate a detailed infographic that explains the 4 seasons as experienced in Toronto, Canada. The infographic is for a grade 3 classroom. Make it in the style of Eric Carle
请制作一张详细的信息图,解释加拿大安大略省多伦多市的四季变化。这张信息图是为三年级课堂设计的,风格请参考艾瑞·卡尔的绘本风格。